Fixed Income Monthly Commentary - July 2020
We are now a little over three months past the peak of recent market uncertainty—the day the U.S. government announced its multi-prong efforts to stimulate and support financial markets and the economy. High yield spreads, as measured by the ICE BofA High Yield Index, had peaked at 1,087 bps and the yield to worst reached 11.39% on March 23—both post-financial crisis high points. The federal government moved forward with plans to support the corporate bond market through purchases on both the primary and secondary market. Subsequently, the investment grade and high yield corporate bond markets rallied. Historic issuance on the investment grade corporate side was met with ever-increasing investor appetite for yield, fueled by U.S. government support. And once the Federal Reserve included high yield ETFs and fallen angels in a subsequent announcement of support on April 9, high yield issuance ramped to historic levels (Exhibit 1).
EXHIBIT 1: 2020 HIGH YIELD CORPORATE MONTHLY ISSUANCE (BILLIONS)
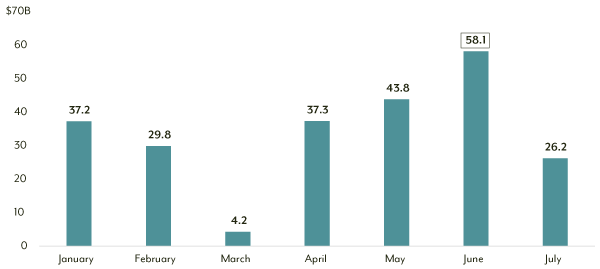
Source: Bloomberg, as of 7/31/20.
It was a rough start to the year through March 23, with the ICE BofA High Yield Index down 20.6%. From March 23 through the end of July, buoyed by government support, the ICE BofA High Yield Index returned 25.6% and is now only down 0.23% year to date—something few considered possible during the market turmoil in late March and early April. July also marked the strongest monthly return (+4.78%) for the ICE BofA High Yield Index since October 2011 (+5.96%).
The number of trading days from the spread peak on March 23 to the end of July is 95 days. The spread-level change over that 95-day period is the most substantial drop in spreads since December 1996—the furthest back the data allows. As shown in Exhibit 2, the other similar periods were during the throes of the financial crisis in 2009—with the exception of the day prior to the end of July.
EXHIBIT 2: PERCENT CHANGE IN OPTION-ADJUSTED SPREAD OVER 95-DAY PERIODS
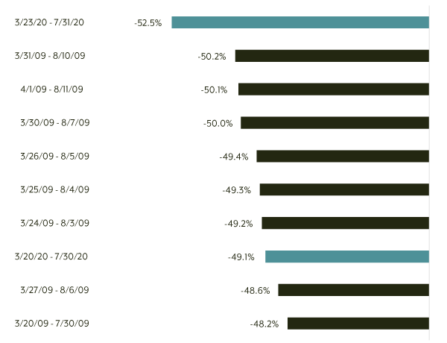
Source: Bloomberg.
The high yield market has experienced a strong recovery, but the government has made it clear it will continue providing support as needed—as evidenced by the recent announcement of the extension of the Federal Reserve’s primary and secondary market corporate credit facilities to the end of the calendar year. While the primary market corporate credit facility has yet to be used, the secondary market corporate credit facility has begun purchasing bonds, albeit minimally. As of the most recent data release on July 10, the Fed has bought roughly $1.6 billion of corporate debt, ranging from well-known names like Apple and Boeing to fallen angels like Ford. Combined with purchases of ETFs totaling nearly $8.0 billion, these purchases leave the Federal Reserve with more than $740 billion in reserves to deploy into the corporate bond market if instability arises once more.
Where does that leave high yield investors at this point in the cycle? Defaults continue creeping higher, approaching 5.5% by the end of July, which would be the highest level since May 2010. Spreads finished the month at 516 bps, which is below the 553 bps historic average, and the yield to worst on the index is 5.46%—only 61 bps from the all-time low of 4.85% reached in June 2014. We believe the bigger issue is the assumption that a high yield allocation needs very wide spreads to deliver compelling returns. Historically, the 3-year forward return for the high yield index from a starting option-adjusted spread level between 500-599 has annualized a maximum of 11.3%, a minimum of -3.1% and an average of 5.4%. Looking at 5-year forward returns in the same scenario, the maximum annualized return is 10.1%, the minimum return is 0.9% and the average return is 6.2%.
It’s important to keep in mind, those historic returns are based on the index—an uninvestable collection of securities meant to represent the high yield market. Employing an active management style that is focused on “standing out by not fitting in” through security selection and investing in market areas that traditionally are minimalized or ignored by the indices can add additional value. Bypassing the larger and more trafficked areas of the market can help avoid beta traps and provide capital to invest in middle-market and small-market off-benchmark names that can offer significant alpha opportunities. At Diamond Hill, the focus on value-add through bottom-up security selection and a willingness to provide differentiated streams of returns from the market and competitors has delivered strong risk-adjusted performance through a variety of market cycles and since inception for our high yield focused High Yield and Corporate Credit strategies.
This material is for informational purposes and is prepared by Diamond Hill Capital Management. The opinions expressed are as of the date of publication and are subject to change. These opinions are not intended to be a forecast of future events, the guarantee of future results or investment advice. Reliance upon this information is in the sole discretion of the reader. Investing involves risk, including the possible loss of principal.
As of May 31, 2020, Diamond Hill owned Apple, Inc. (debt), Boeing Co. (debt) and Ford Motor Co. (debt). As of June 30, 2020, Diamond Hill owned Boeing Co. (equity, short).
The ICE BofA U.S. High Yield Index tracks the performance of the U.S. dollar denominated below investment grade corporate debt publicly issued in the U.S. domestic market. The index data referenced herein is the property of ICE Data Indices, LLC, its affiliates (“ICE Data”) and/or its third party suppliers and has been licensed for use by Diamond Hill Capital Management, Inc. ICE Data and its third party suppliers accept no liability in connection with its use. See diamond-hill.com/disclosures for a full copy of the disclaimer.