Seeing Through the Fog – Corporate Market Update
We’re now five months past the recent height of credit spreads—when pandemic-driven panic effectively brought corporate bond trading to a standstill as liquidity evaporated. At that time, it was hard to envision how credit markets would start functioning normally again—yet, that’s largely what happened. We saw more evidence of the health of corporate markets from the Fed’s release on the secondary market corporate credit facility (SMCCF) purchases for July.
Before digging into that release, some background: The SMCCF launched with $250 billion available to purchase both corporate bonds and ETFs on the secondary market, and the primary market corporate credit facility (PMCCF) launched with $500 billion. Both were intended to bring stability to the corporate bond market, and they’ve succeeded—even without having been used much. The SMCCF has used only roughly 5% of the original $250 billion earmarked while the PMCCF has yet to be used at all as the markets have proven more than able to devour the historic level of issuance in the investment grade space.
What Has the Fed Purchased?
The SMCCF began purchasing ETFs on May 12 but did not begin purchasing corporate bonds directly until June 16. By July’s end, the SMCCF held $8.7 billion in ETFs and another $3.6 billion in individual corporate bonds—combined only 4.9% of the facility’s purchasing power. Within the corporate bond purchase program, the sector breakdown (Exhibit 1) shows that the purchases have been broadly distributed, with the largest allocations to consumer non-cyclical, consumer cyclical and financials.
EXHIBIT 1: SMCCF CORPORATE BOND PURCHASES
| SECTOR |
WEIGHT |
| Consumer, non-cyclical |
22.22% |
| Consumer, cyclical |
15.19 |
| Financials |
12.91 |
| Utilities |
10.34 |
| Industrial |
10.28 |
| Energy |
9.19 |
| Communications |
8.38 |
| Technology |
8.17 |
| Basic materials |
3.32 |
Source: Bloomberg, as of 7/31/20.
The Fed has focused on pharmaceuticals (7.92%) and beverages (3.16%) within consumer non-cyclical and autos (10.79%) and retail (3.20%) in the consumer cyclical sector. More than half the financials purchases (6.38%) are in the insurance industry. From a credit quality standpoint, the bond purchases are more focused in the lower rated investment grade category, with 55.6% rated BBB and 3.0% rated BB. AAA/AA/A-rated issuances comprise 41.4% of the total bond purchases. The constraint of bond maturity (no more than 5 years) has kept the weighted average maturity of the purchases at 2.90 years.
Within the ETF space, the purchases have been split between investment grade and high yield ETFs—roughly 87% and 13%, respectively. From a maturity standpoint, the ETF purchases have been focused on the shorter end of the curve, with 47.5% of the ETFs in the 1-3 year duration range, 22.5% in the 3-7 year range and 30.0% greater than 7 years.
Trends
- The SMCCF halted ETF purchases on July 24. Exhibit 2 shows the Fed continually slowing the purchases before exiting that part of the market. The trend of corporate bond purchases is following the same trajectory as the ETF purchases, with a substantial reduction in the final weeks of the month. From the beginning of the SMCCF purchasing corporate bonds on June 16 through the middle of July, the daily average was $143 million per day; however, in the final two weeks of July average daily purchases dropped to $34.7 million.
- Exhibit 2 also shows the decline in purchases relative to the decline in the option adjusted spread (OAS) of the ICE BofA U.S. High Yield Index. As spreads tightened from peak levels in March to levels below the historic average (553 bps), the Fed has slowed its purchases.
- Despite the cessation of ETF purchases on July 24, the percentage of ETFs of the total securities held by the SMCCF is still elevated at 70%.
- Despite the Fed’s efforts to publicize the PMCCF, there has not been one deal completed using the facility. It is possible the Fed may shift some of the available funds from the PMCCF to the SMCCF. Given that the SMCCF has used less than 5% of the $250 billion available, it’s doubtful this change would be necessary.
- In the most recent update on the SMCCF, the Fed provided additional information as to extension of the programs from the end of Q3 to the end of the year, citing that “output and employment remain far below their pre-pandemic levels.” Could the program continue into next year if “output and employment” continue to struggle into 2021?
EXHIBIT 2: PURCHASES SLOW AS SPREADS TIGHTEN
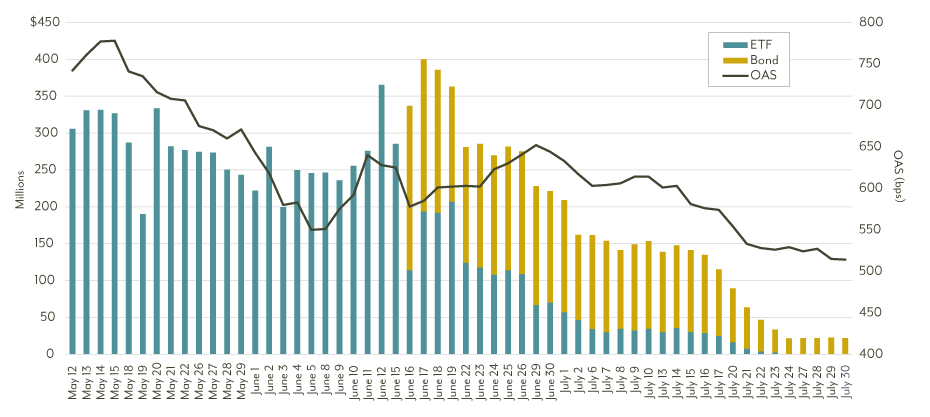
Source: Bloomberg, as of 7/31/20. OAS is based on the ICE BofA U.S High Yield Index.
What Does It All Mean?
The transparency behind the SMCCF and the insight it provides into the Fed’s actions to support the corporate bond market is beneficial, but it must be pointed out that the corporate bond market rallied well before the Fed stepped into the markets. Just the announcement on March 23 of the Fed’s move to purchase corporate bonds on the primary and secondary market was enough to shift the market outlook. By the time the SMCCF stepped into markets to begin purchasing ETFs on May 12, the spread on both the ICE BofA U.S. High Yield and ICE BofA U.S. Corporate indices had compressed substantially—from 1,087 bps and 401 bps, respectively, to 742 bps and 222 bps. As the SMCCF began purchasing ETFs on May 12 and expanded to include corporate bonds on June 16, the OAS for the high yield index continued tightening, finishing July at 516 bps, less than the spread on March 23 and below its historic average of 553 bps. Likewise, the ICE BofA U.S. Corporate Index OAS finished July at 141 bps while the yield to maturity for the index plunged below 2%, setting a record low.
Since the launch of the SMCCF and PMCCF, the high yield market has delivered its best single month performance (4.78% in July) since October 2011 and best four-month stretch from April to July (14.84%) since 2009. The investment grade corporate market has delivered its best four-month performance from April to July (12.71%) since 2009. During this time, we’ve seen Q1’s record investment grade issuance ($471 billion) quickly surpassed by a record $668 billion in Q2 with an additional $66 billion in July to push the year-to-date total to $1.2 trillion—close to surpassing the record $1.25 trillion issuance set during 2017. The high yield market broke records as well— May, June and July all saw record levels of issuance, with the year-to-date issuance poised to surpass all of last year’s production.
So, despite the volatility and chaos of the first months of this pandemic, the corporate market appears to be functioning well—merely the notion that the Fed was ready to supply massive support seems to have calmed investors. Where does that leave the markets? For the high yield market, relatively attractive yield (5.46% yield to worst as of July 31, 2020) with lower duration (3.71 years), especially when compared to the investment grade corporate space (1.92% yield with 8.45 years duration). And should uncertainty and volatility emerge once more, whether due to continued spread of the pandemic or the upcoming November election, the SMCCF and PMCCF stand ready to help keep markets functioning.
This material is for informational purposes and is prepared by Diamond Hill Capital Management. The opinions expressed are as of the date of publication and are subject to change. These opinions are not intended to be a forecast of future events, the guarantee of future results or investment advice. Reliance upon this information is in the sole discretion of the reader. Investing involves risk, including the possible loss of principal.
Investment Grade is a Bond Quality Rating of AAA, AA, A or BBB.
The ICE BofA U.S. High Yield Index tracks the performance of the U.S. dollar denominated below investment grade corporate debt publicly issued in the U.S. domestic market. The ICE BofA U.S. Corporate Index tracks the performance of U.S. dollar denominated investment grade corporate debt publicly issued in the U.S. domestic market The index data referenced herein is the property of ICE Data Indices, LLC, its affiliates (“ICE Data”) and/or its third party suppliers and has been licensed for use by Diamond Hill Capital Management, Inc. ICE Data and its third party suppliers accept no liability in connection with its use. See diamond-hill.com/disclosures for a full copy of the disclaimer.