Fixed Income Monthly Commentary — January 2021
With the COVID-19 vaccine rollout accelerating in the U.S.—though not without some hiccups—the eyes of the market turned to the economy. Less than stellar non-farm payrolls (December down 140,000) and an acceleration in jobless claims, combined with a potentially more virulent strain of the virus, raised concerns about another slowdown in the first half of the year. While there’s a light at the end of this long tunnel, we must consider there is barbed wire and landmines between here and the tunnel’s end. But let’s look to the second half of the year, assuming continued vaccine rollout and a gradual re-opening of the economy.
If, as some economists expect, the pent-up demand from a year-long lockdown is unleashed in the second half of the year, the economy could see considerable growth. The question then becomes how and when does the Federal Reserve adjust its purchase program and do we risk another “taper tantrum” similar to 2013. To understand where we may be headed, let’s take another look at what happened in 2013.
2013 Refresher
As you may recall, the Federal Reserve pulled out all the stops to help the country weather the 2008-2009 financial crisis, including purchasing U.S. Treasury and Agency mortgage debt and increasing the Fed balance sheet to historic levels. The Fed was purchasing $85 billion in securities monthly and unemployment was slowly improving while inflation remained firmly below 2.0% (Figure 1).
Figure 1: Unemployment, inflation and the Fed balance sheet in 2013
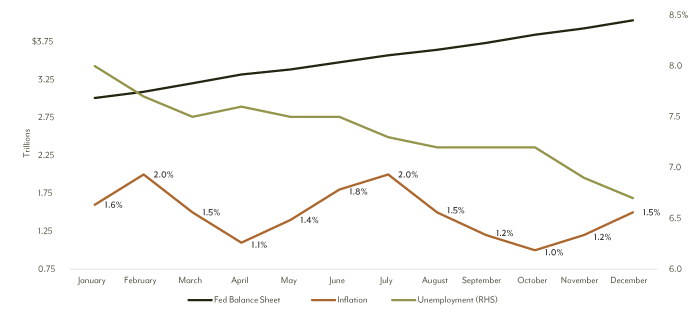
Source: Bloomberg, Federal Reserve.
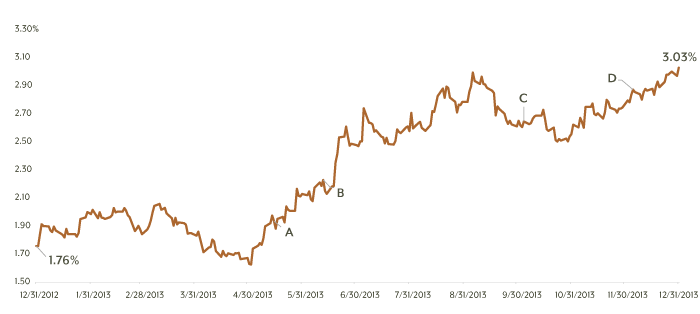
Below we outline key dates and the corresponding move in 10-year Treasury yields throughout the year (Figure 2).
A – May 21, 2013: Federal Reserve Chair Ben Bernanke appeared before Congress and the Joint Economic Committee. Bernanke first revealed the FOMC’s view on a taper in answering a lawmaker’s question, “If we see continued improvement and we have confidence that that’s going to be sustained then we could in the next few meetings...take a step down in our pace of purchases.”
Bond yields took off—10-year jumped from 1.93% to its peak of 3.00% on September 5—and financial conditions tightened in the following months, surprising the Fed.
B – June 19, 2013: FOMC Press Conference. Bernanke clarified that any change in bond purchases would depend on the economic outlook and would be distinct from interest rate decisions. Thereafter, Bernanke’s ongoing comments convinced the market that any decision would depend on incoming data and would be clearly communicated.
C – October 16, 2013: Impromptu video conference call during which the Fed discussed how the central bank would respond if the U.S. government defaulted on its debt due to Congress’ refusal to raise the debt ceiling.
D – December 18, 2013: Final Fed meeting of the year. The Fed finally took the first small step toward unwinding the balance sheet, announcing it would begin reducing purchases in 2014 from $85 billion a month to $75 billion a month and would continue reducing in “measured steps” if the economy continued to perform well.
Figure 2: 10-Year Treasury Yield
How did the 10-year Treasury fare during the taper tantrum? Using the Bloomberg Barclays U.S. 10-year Treasury Bellwethers Index as the proxy, the measuring stick for interest rates lost 7.81% in 2013. To put that in perspective, in the 40 years since 1980, the Index delivered negative returns in only six calendar years while weathering yield increase (Figure 3).
Figure 3: Bloomberg Barclays U.S. 10-year Treasury Bellwethers Index
|
Return |
Starting Yield |
Ending Yield |
Change |
| 2009 |
-9.76 |
2.21% |
3.84% |
+163 bps |
| 1999 |
-8.43 |
4.65 |
6.44 |
+179 bps |
| 1994 |
-7.85 |
5.79 |
7.82 |
+203 bps |
| 2013 |
-7.81 |
1.76 |
3.03 |
+127 bps |
| 1987 |
-3.16 |
7.22 |
8.86 |
+164 bps |
| 2016 |
-0.16 |
2.27 |
2.45 |
+18 bps |
Where are we today?
The U.S. bond market has been in a bull market since the mid-1980s as the 10-year Treasury yield has ground tighter from the mid-teens to its current level of roughly 1%. Granted, there have been periods of upheaval (Figure 3) as rates moved higher—the market recovered and continued the slog lower once rate volatility subsided. The run over the past decade has been driven, in part, by the Federal Reserve’s continued support of the market through bond purchases, which began with Treasury and mortgage debt, expanded to include corporate bonds and ETFs, and is now back to “just” $80 billion in U.S. Treasury and $40 billion in mortgages each month. These purchases have pushed the Federal Reserve balance sheet to more than $7 trillion. But the ride must end at some point and thus a possible taper tantrum.
For markets to function more normally, the Federal Reserve needs to slowly remove itself from the market and allow market dynamics to return. The logistics around the Fed exiting the Treasury and mortgage markets are rather straightforward: reducing Fed purchases in the market will result in higher yields and will entice new investors to pick up the slack. Figure 4 illustrates the 10-year Treasury yield as the Fed ramped up purchases during the financial crisis through the initial tapering in 2014 and to the current state of purchases in the market. Figure 5 shows the impact from mortgage purchases on the option-adjusted spread of the Bloomberg Barclays U.S. Mortgage Backed Securities (MBS) Index. It stands to reason that a significant buyer of both Treasuries and mortgages exiting those markets, albeit slowly, will have a lasting impact.
Figure 4: 10-year Treasury Yield
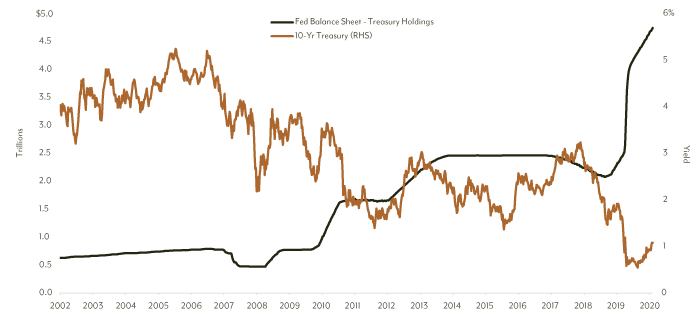
Source: Bloomberg, Federal Reserve.
Figure 5: Bloomberg Barclays U.S. Mortgage Backed Securities (MBS) Index
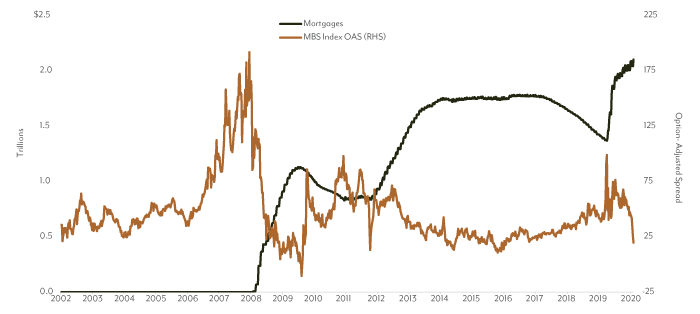
Source: Bloomberg, Federal Reserve.
Much like winter, tapering is coming. The market impact will be felt once we hear from Fed members that the winds are shifting away from maintaining the status quo to contemplation of timing and structure.
As we learned in 2013, the mere suggestion of tapering created market volatility and uncertainty, and the Fed was forced to retreat and reconsider its approach. With 2013 firmly in their minds, Fed members will work diligently to deliver the right pace and tone of communication, but even then, the markets will react as they do, trying to anticipate Fed action and get ahead of it.
We’ve already seen a bit of errant messaging on January 11 with comments from Federal Reserve presidents Raphael Bostic (Atlanta) and Dr. Robert Kaplan (Dallas) about a potential late-2021 tapering, which subsequently pushed the 10-year Treasury to 1.15%, its highest level since mid-March 2020. Media appearances by various Federal Reserve members the following day served to cool tapering talk as communication shifted to needing the economy on firm footing before considering any kind of tapering program. Additionally, former Vice Chairman of the Federal Reserve Bank of New York Bill Dudley published an article stating, “there’s little the Fed can do to prevent another taper tantrum. The best it can do is be prepared and communicate clearly and consistently.” While the 10-year Treasury yield dropped from its peak of 1.15% to finish the month at 1.07%, it did finish 15 bps higher than when it began the month. A sign of things to come? Most definitely.
The Federal Reserve left rates unchanged at their first meeting of 2021, which wasn’t surprising. The Fed was clear that asset purchases will continue until “substantial further progress” has been made in getting the economy back on firm ground, which could take “some time.” Despite some minor language adjustments, the meeting was essentially a non-event. So, Jerome Powell and the Federal Reserve made it through their first test of the year unscathed, but concerns remain regarding the future path of rates and the overall market and economic impact.
This material is for informational purposes and is prepared by Diamond Hill Capital Management. The opinions expressed are as of the date of publication and are subject to change. These opinions are not intended to be a forecast of future events, the guarantee of future results or investment advice. Reliance upon this information is in the sole discretion of the reader. Investing involves risk, including the possible loss of principal.
The Bloomberg Barclays 10-Year U.S. Treasury Bellwethers Index is a universe of Treasury bonds and is used as a benchmark against the market for long-term maturity fixed-income securities. The index assumes reinvestment of all distributions and interest payments.