The Fixed Income Market in 6 Charts
Cash is flowing into risk assets, the 10-year treasury is battling to stay above 1.50%, and the Fed continues to think about thinking about tapering. What does this current environment mean for fixed income investors looking for yield?
We examined yields from two angles—yield to worst (YTW) and option adjusted spread (OAS)—and provided some insights on where we stand and what areas of the market might be more promising from a yield perspective.
Yield to Worst
In Exhibits 1 and 2, the grey bar represents the YTW range for each sector or subsector from 12/31/2006 through 6/14/2021. The yellow line is the current YTW, while the green line represents the average over this period.
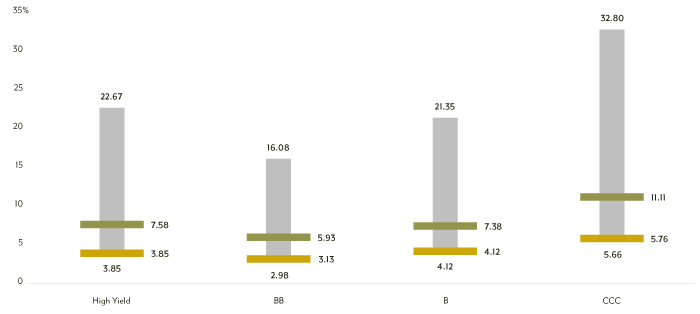
All areas of the market are well below their 15-year averages. Sectors in the investment grade market are nearing their lowest YTW levels, while the overall high yield market and the B segment are at their lowest levels in almost 15 years.
Longer duration combined with historically low yields has been a dangerous combination and place security selection at the forefront of investment management.
Exhibit 1–Investment Grade Credit, Yield to Worst
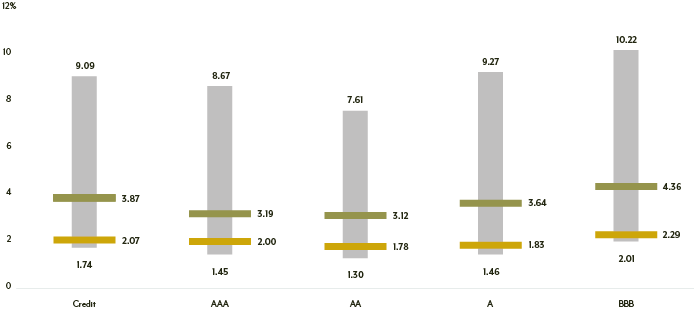
Exhibit 2–High Yield, Yield to Worst
Option Adjusted Spread
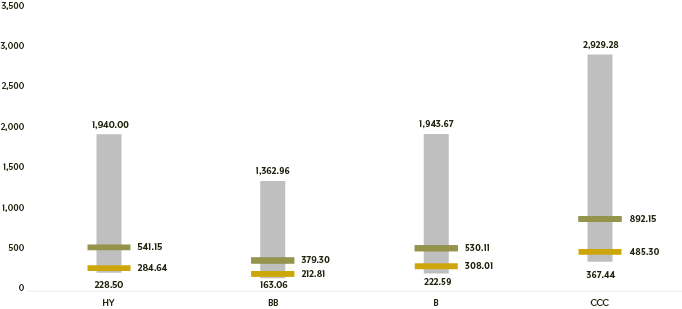
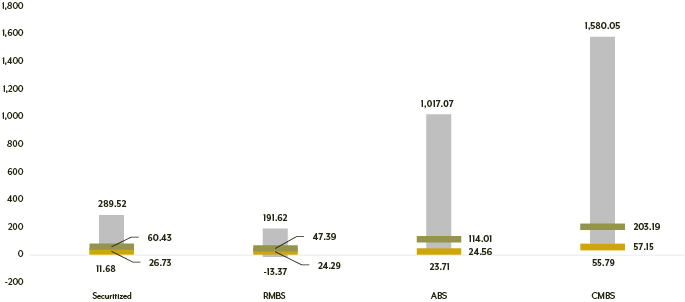
We see a similar story in Exhibits 3 and 4 when looking at option adjusted spreads across market sectors and subsectors over the same period. Spreads are tight and several parts of the market are within shouting distance of their 15-year lows. Some sectors are already hitting those lows, reflecting the rush of cash into risk assets.
Exhibit 3–Investment Grade Credit, Option Adjusted Spread
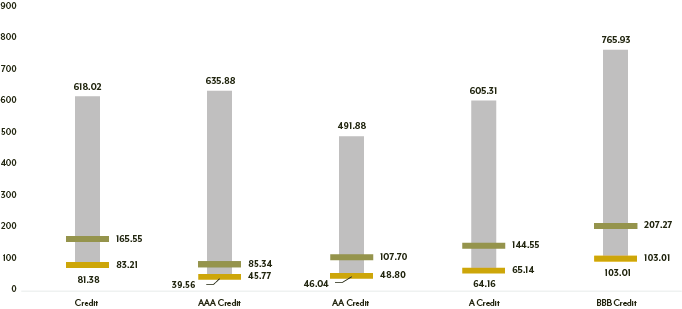
Exhibit 4–High Yield, Option Adjusted Spread
Are Securitized Assets Relatively More Attractive?
Given this environment, we believe the securitized market continues to offer attractive relative yield, especially when one considers the duration impact (low in securitized, high in credit) and the potential for rising rates.
Exhibit 5–Securitized, Yield to Worst
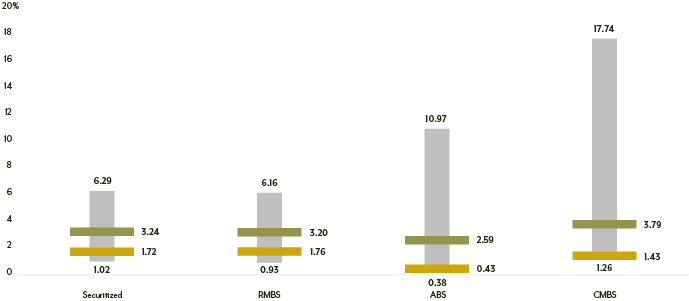
Exhibit 6–Securitized, Option Adjusted Spread
This material is for informational purposes and is prepared by Diamond Hill Capital Management. The opinions expressed are as of the date of publication and are subject to change. These opinions are not intended to be a forecast of future events, the guarantee of future results or investment advice. Reliance upon this information is in the sole discretion of the reader. Investing involves risk, including the possible loss of principal.