Tapering vs. Tantrums — What's In Store?
As more tapering rhetoric comes out, are there lessons to be learned from previous tapering and tantrums? We take a brief look back in history to see if we can gather any insights about the potential tapering ahead of us and what it means for investors.
A Brief History
Since the Global Financial Crisis in 2008, the Federal Open Market Committee (FOMC) has utilized bond purchasing (purchases of U.S. Treasury, agency mortgage-backed securities (MBS) and other debt) as the main tool to stimulate the economy and bring stability to financial markets. The first instance, referred to as Quantitative Easing, began in November 2008 when the Fed announced it would purchase $600 billion in bank debt, U.S. Treasury notes and MBS. By the end of the program in February 2010, the Fed had purchased $1.25 trillion in MBS and $700 billion in longer-term U.S. Treasury debt.
Faced with ongoing financial difficulties in the market, the Fed announced in November 2010 that it would increase its easing program by purchasing $600 billion in Treasury securities by the end of Q2 2011, maintaining its holdings at roughly $2 trillion. This program earned the name Quantitative Easing II.
Exhibit 1 – A Quick History of QE, Twist, QT and Tapering
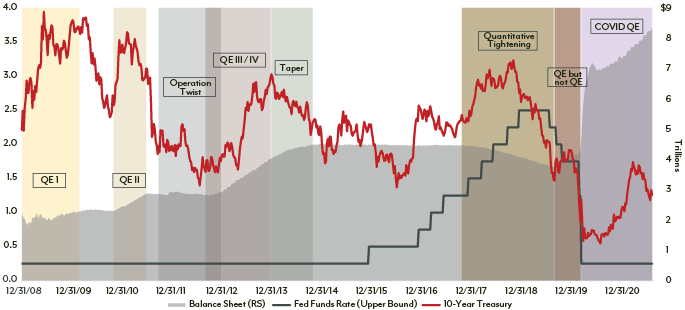
Source: Bloomberg / Federal Reserve Bank of St. Louis.
To support the sluggish housing market and anemic economic recovery, the Fed implemented Operation Twist in September 2011 where it utilized proceeds from maturing short-term Treasury bills to purchase long-term Treasury notes and increased purchases of MBS. Operation Twist would continue until its completion in December 2012, but the Fed also launched Quantitative Easing III in September 2012, overlapping Operation Twist for three months. Under Quantitative Easing III, the Fed would purchase $40 billion in MBS while continuing Operation Twist, adding an additional $85 billion of liquidity a month to the markets. The Fed also announced it would keep the Fed Funds rate at zero until at least 2015 and would continue purchasing securities until jobs improved “substantially”.
In December 2012, the Fed effectively ended Operation Twist and extended Quantitative Easing III into the launch of Quantitative Easing IV. The Fed announced intentions to purchase a total of $85 billion in long-term Treasury and MBS debt and delivered the pronouncement that it would keep purchasing securities until one of two conditions were met: unemployment fell below 6.5% or inflation rose above 2.5%. This essentially open-ended mandate gave the program the nickname Quantitative Easing Infinity, since there was the possibility that neither of those targets would be reached.
With the economy finally emerging from the damage wrought by the Global Financial Crisis (GFC), expectations began to grow for a wind down in the Quantitative Easing program. But markets were caught off guard on June 19, 2013, when Fed Chair Ben Bernanke announced a tapering of the Fed’s bond buying program, contingent upon continued positive economic data. Bernanke stated that the Fed could scale back bond purchases to $65 billion per month at the September Fed meeting and wrap up purchases by mid-2014. The subsequent taper tantrum (Exhibit 2) created havoc in the financial markets, hammering stocks and creating volatility in the rates markets. In the immediate days following Bernanke’s comments, the S&P 500 dropped nearly 3.5% before rebounding rather quickly while the 10-year Treasury jumped from 2.19% to 2.74% over the subsequent two weeks. Once the markets were given time to stabilize and digest the impact of the purchase program taper, the Fed announced in December 2013 that it would begin actual tapering in January 2014. The Quantitative Easing process that began in late November 2008 and garnered a variety of names since its inception ended in October 2014.
Exhibit 2 – 2013 Taper Tantrum
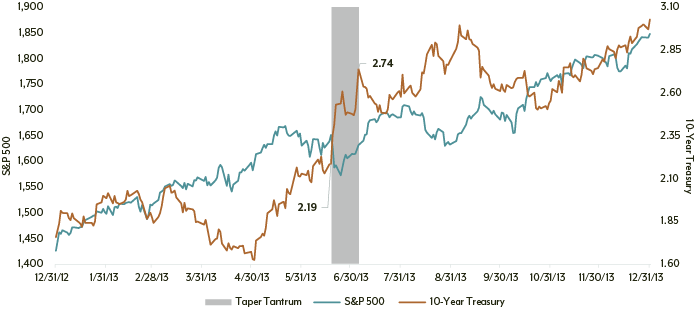
Source: Bloomberg.
With Quantitative Easing and tapering a thing of the past—at least we thought so at the time—the Fed was now tasked with managing a bloated balance sheet and determining how best to bring it under control. Following the ramp up that occurred in the Fed balance sheet through the end of 2014, any maturing securities in the portfolio would be replaced by purchasing other securities to keep the balance sheet fairly constant (as illustrated in Exhibit 3 from October 2014 to October 2017). The FOMC announced in September 2017 that balance sheet normalization would begin in October as the Fed would allow $6 billion in Treasuries and $4 billion in MBS to mature each month and not be replaced. The limits or “caps” would increase each quarter until they reached $30 billion in Treasuries and $20 billion in MBS, per month. Quantitative Tightening, as the process came to be called, continued until March 2019 when the Fed announced that the monthly cap for Treasuries would be reduced from $30 billion per month to $15 billion per month, thus slowing the reduction the Fed’s balance sheet.
Exhibit 3 – The Growth of the Fed Balance Sheet Since the Global Financial Crisis
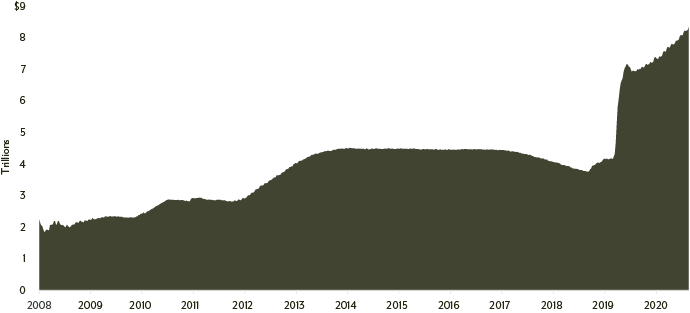
Source: Federal Reserve Bank.
And this worked—for a time. During the normalization process, the Fed reduced the balance sheet by more than $600 billion in assets pushing the balance sheet to $3.7 trillion in September 2019— significantly higher than the $2.2 trillion in December 2008 but lower than the post-GFC peak level of $4.5 trillion. But a massive liquidity crunch began on September 16, created by a perfect storm of quarterly corporate tax payments withdrawn from banks and money market funds combined with a large Treasury auction occurring at a time when the Fed was reducing the size of its balance sheet, resulting in reserves in the banking system declining by $120 billion in two business days. This created a supply-demand mismatch as there were more Treasury securities to be financed in the market with relatively less cash, which forced the Fed back into the business of supporting the markets, but this time focused on the very short end of the curve. The Fed reintroduced a tool from the 2008 playbook, conducting overnight repurchase operations to make sure funding for overnight loans stayed constant and the Fed funds rate remained in its target range at the time of 1.75% to 2.00%.
The Fed’s balance sheet was well on its way back to its post-crisis levels when the COVID-19 pandemic shook the world. What started as a $500 billion Treasury and $200 billion MBS purchase commitment on March 15, 2020, quickly became an open-ended checkbook for purchases. On March 23, with capital markets completely locked up and the country on lockdown, the FOMC expanded COVID-Q/E to an unlimited amount and by May 18 the balance sheet had eclipsed $7 trillion. To thaw the corporate market, the Fed also announced the launch of the Primary and Secondary Market Corporate Credit Facilities to provide liquidity to the corporate market by purchasing outstanding and new issue corporate debt. Though originally given $750 billion to allocate to the corporate market, the Fed only spent around $14 billion to purchase secondary corporate issuance and exchange traded funds (ETFs). The Fed began selling corporates bonds and ETFs in June 2021 and currently holds $3.6 billion in bonds and $1.1 billion in ETFs.
More Questions Than Answers
Today, the Fed balance sheet continues to grow unabated. And only recently, at the Jackson Hole virtual meeting, has the Fed Chair directly discussed any kind of tapering despite some of his fellow FOMC members vocally calling for it to start sooner rather than later. There’s no more “talking about talking about tapering” or thinking about it. Barring any kind of dramatic flare up in infection due to Delta or the rapid-fire emergence of an even more dangerous variant, expectations are for tapering to begin before the end of 2021.
But what exactly will that look like? That remains to be seen. Many are under the belief that it will operate in a similar fashion to what we’ve seen in the past, the only question being the speed at which it is done. Though they may differ on the timing of the start of tapering, it appears that various members of the FOMC have fallen into line with the notion of conducting it in such a way that the purchases of MBS and Treasuries end at the same time, rather than one finishing before the other.
Remember, tapering is only the reduction of monthly purchases, not the cessation of all purchasing activity. How long will the process take this time around? Given the dramatic downturn last year and equally dramatic economic recovery, it wouldn’t be a shock to see this taper take a much more aggressive approach to conclusion.
Other questions remain regarding what happens once tapering has concluded, and the Fed is no longer an active buyer in the market. Will the Fed follow previous plans and continue to roll maturing securities into purchases to keep the balance sheet steady at more than $8 trillion? Or will the Fed move into balance sheet normalization mode and allow securities to mature and not replace them on the balance sheet? Previously, the Fed waited more than a year before moving the Fed Funds rate higher, increasing by 25 basis points (bps) at the end of 2015 and waiting another year before increasing by another 25 bps and then proceeding on a course of 25 bps on a near regular basis until July 2019. Faced with uncertainty due to brewing trade wars that clouded the economic outlook, the Fed implemented a mid-cycle adjustment to policy and cut rates 25 bps and followed that cut with two additional 25 bps reductions in the following quarters.
Though we have gained some clarity regarding the timing of the COVID-tapering, which should begin before the end of the year, we are now beset with a new set of questions that will take time and insight to answer. With clarity comes additional uncertainty.
SECTOR IN FOCUS – Investment Grade Credit
Despite some short-lived volatility near the end of Q1, option-adjusted spread levels in the investment grade corporate sector have continued to grind tighter since the beginning of the year, finishing the month of August at 86.4 bps. While this represents a move higher from the low point reached at the end of June (80.2 bps), the current level remains almost half of the average level since 2002 (151.9 bps).
The index’s duration of 8.69 years remains within striking distance of its all-time high level of 8.84 years and nearly one year longer than it was at the beginning of 2020 (7.90 years). The yield to worst for the corporate sector remains mired below 2% (1.99% at month end) and well below the average (4.12%) since 2002.
With the limited upside opportunity and significant interest rate risk presented by the investment grade corporate market, we continue to maintain an underweight posture relative to the benchmark in favor of relatively more attractive securitized assets.
Investment Grade Credit Option Adjusted Spread (OAS) and Duration
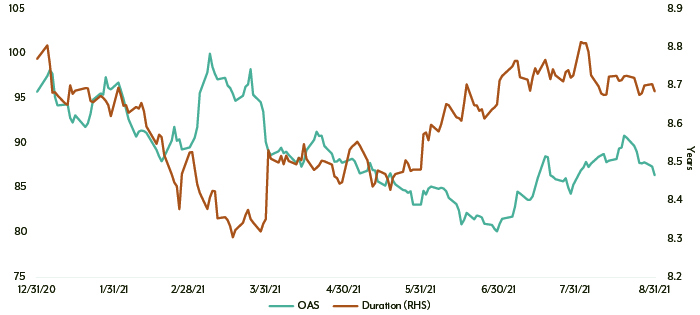
Source: Bloomberg.
The S&P 500® Index is a market capitalization-weighted index focused on the large-cap segment of the market. The index is comprised of 500 of the top companies in leading industries in the U.S. economy. The Bloomberg Barclays U.S. Corporate Bond Index is an unmanaged index representing the investment grade fixed rate taxable corporate bond market including USD-denominated securities publicly issued by U.S. and non-U.S. industrial, utility, and financial issuers. The Bloomberg Barclays Treasury Bond Index measures U.S. dollar-denominated, fixed-rate, nominal debt issued by the U.S. Treasury. Index data source: Bloomberg Index Services Limited. See diamond-hill.com/disclosures for a full copy of the disclaimer.
The views expressed are those of the author as of August 2021, are subject to change, and may differ from the views of research analysts, portfolio managers or the firm as a whole. These opinions are not intended to be a forecast of future events, a guarantee of future results, or investment advice. Investing involves risk, including the possible loss of principal.