The Recipe for Rate Hikes–Inflation + Unemployment
By the time this commentary is published, we will have confirmation as to whether the Fed is going to utilize the early November Federal Open Market Committee (FOMC) meeting to officially commit to what we all know has been coming for a while–tapering.
The Fed has previously outlined that “substantial further progress” is needed to start tapering, a rather nebulous concept only the Fed can measure. Based on comments from Federal Reserve members, it seems as though the U.S. economy has achieved “substantial further progress” and tapering will most likely begin in November or December, with a completion date sometime in mid-2022.
As we discussed in our piece Tapering vs. Tantrums, though the Fed may have answered the question of when tapering will begin, more questions remain unanswered. How long will the tapering process play out? Will the Fed maintain the balance sheet by reinvesting maturing securities as it did following the previous taper? When will quantitative tightening (actively selling assets off the balance sheet) begin, if ever? Only time (and the Fed) can provide specific answers to these questions.
The Fed has been slowly preparing the market for the tapering of monthly Treasury and agency mortgage-backed securities purchases, so there’s little chance of a market shock coinciding with the announcement. A quick recap of the messaging from the Fed regarding tapering:
- March 2021–“It is not time to start talking-about-talking-about tapering” (Powell), which of course got everyone talking about tapering.
- May 2021–San Francisco Federal Reserve Bank President Mary Daly stated, “We are talking-about-talking-about tapering.”
- June 2021–Powell’s statement, “You can think of this meeting as the talking-about-talking-about tapering.”
- Post-September FOMC meeting–Powell said, “While no decisions were made, participants generally view a gradual tapering process that concludes around the middle of next year is likely to be appropriate.”
- October 2021–Powell stated, “I do think it’s time to taper; I don’t think it’s time to raise rates.”
So, tapering should be underway soon, which shifts attention to interest rates and expectations for a liftoff from the current level of 0.00% to 0.25%. The two measuring sticks, as dictated by the Federal Reserve, for a liftoff in rates are inflation and employment.
Inflation
As time moves forward, we will gain a better understanding of inflation and whether or not it is transitory. This reveals another admirable communications tactic by the Federal Reserve. Introducing the term transitory, which I’m sure everyone is tired of hearing, provided the Fed an open-ended interpretation to give it time to assess the true nature of inflation.
At what point does higher than expected inflation stop being transitory? The Fed holds the answer and most likely won’t share until it knows for certain. Supply chain disruptions will continue to wreak havoc on the global economy and disproportionate supply and demand imbalances will continue impacting prices.
Employment
Employment, the second of the two interest rate liftoff indicators, has experienced a solid rebound since the early days of the pandemic with the unemployment rate declining to 4.8%, well below the 6.4% pre-pandemic average from early 2008 through March 2020.
While the unemployment rate is not back to pre-pandemic levels (3.5% in February 2020), it is closing in on the natural rate of employment, now known as the noncyclical rate of unemployment (NAIRU). This measurement reflects the number of people who are unemployed due to the structure of the labor force, i.e., those replaced by technology or those who lack certain skills to gain employment. Think of it as the “acceptable” rate of unemployment in a normal economic environment.
Exhibit 1 – Noncyclical Rate of Unemployment
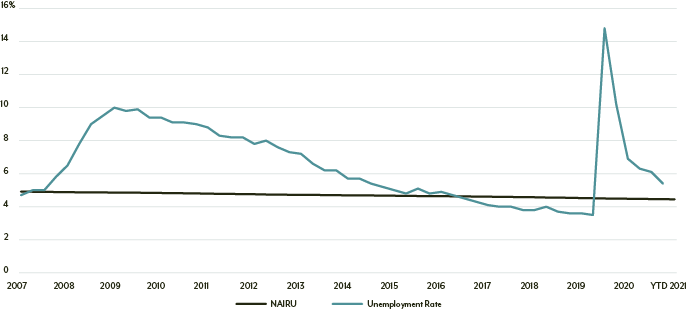
Source: U.S. Congressional Budget Office, Noncyclical Rate of Unemployment, retrieved from FRED, Federal Reserve Bank of St. Louis; https://fred.stlouisfed.org/series/NROU.
This does not mean the economy is back to the natural level of full employment but rather those who are looking for work are able to find it. In fact, we’re now in a position where we have too many openings and not enough people willing to fill them. Take my hometown, for example. A well-known fast-food restaurant is now forced to limit hours from 4–6 p.m. daily, as it cannot find enough people to maintain full shifts throughout the week. There are anecdotal stories like this all around the country. Where have all the workers gone?
The impact of missing workers is most apparent when you look at the participation rate (Exhibit 2), a measure of an economy's active workforce. The formula for the participation rate is the sum of all workers who are employed or actively seeking employment divided by the total civilian working-age population.
Exhibit 2 illustrates the long-term trend of a decreasing participation rate, fueled mostly by retirement of an aging population, which accelerated during the pandemic. The drop in the participation rate from pre-pandemic to September 2021 (most recent data available) can be attributed to the decrease in the Civilian Labor Force (3.09 million) and the increase in those who are not in the labor force (4.98 million). The Civilian Labor Force includes all people aged 16 or older who are classified as either employed or unemployed, which conceptually means it is the measurement of those either working or actively looking for work. Those considered not in the labor force are people who were not employed during the survey time-period and have not actively looked for work in the last four weeks.
Exhibit 2 – U.S. Labor Force Participation Rate
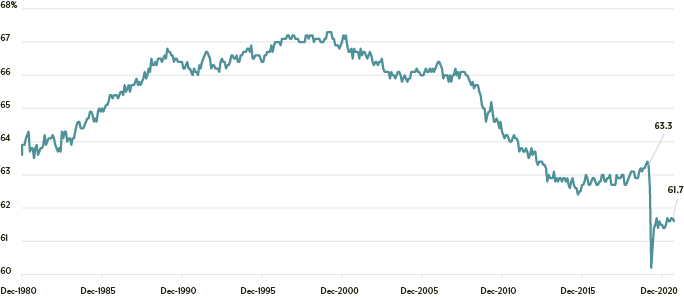
Source: Bureau of Labor Statistics.
Powell himself noted there are still five million fewer workers than there were before the pandemic, as noted in Exhibit 3, despite the strong rebound in the employment since the early days of the pandemic. Despite the expiration of extra jobless benefits in September, workers are leaving jobs in what has become known as the Great Resignation—the U.S. Bureau of Labor Statistics estimated that 4.3 million people quit their jobs in the month of August alone.
Exhibit 3 – U.S. Employment Statistics (Numbers in thousands)
|
February 2020 |
September 2021 |
Change |
| Employed
|
158,732
|
153,680
|
(5,052) |
| Unemployed
|
5,717
|
7,674
|
1,957 |
| Civilian Labor Force
|
164,448
|
161,354
|
(3,094) |
|
|
|
|
|
| Not in Labor Force
|
|
|
|
| Do not want a job now
|
88,926
|
92,931
|
4,005 |
| Want a job now
|
4,973
|
5,710
|
737 |
| Want a job now – marginally attached
|
1,494
|
1,732
|
238 |
| TOTAL
|
95,393
|
100,373
|
4,980 |
Source: Bureau of Labor Statistics.
While Powell and company are aware of the nuances in the labor market due to the Great Resignation, as well as the shift in the labor force, the Fed’s focus remains on the two measuring sticks—inflation and employment. The market is not necessarily focused on how many people left the labor force or the decrease in the number of employed citizens in the U.S. Instead, the market is focused on the unemployment rate, and expectations continue to rise for a rate move mid-2022.
Market Expectations for a Rate Hike
The shift in market expectations is yet another example of the incredibly short-lived value of the dot plot, published by the FOMC on a quarterly basis. The most recent dot plot, released after the September 22 FOMC meeting (Exhibit 4), saw a shift in expectations from the previous version with one member increasing expectations from one rate hike to two in 2022 and another moving from no hikes to one in 2022.
Exhibit 4 – Dot Plot
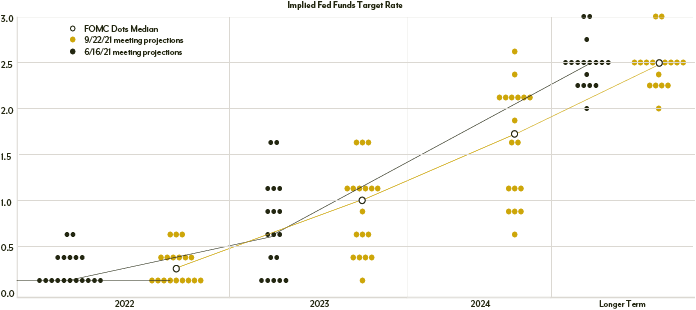
Source: Bloomberg.
This shift in expectations pushed the overall estimate from no rate hike in 2022 to one rate hike next year, but the report does not offer insight into timing. And that’s where market expectations come in, as participants attempt to parse every Fed comment and economic data point into any kind of insight into potential rate moves.
Has the Fed lost control of the narrative around timing of the first interest rate hike, which it has said would come in late 2022? If we assume tapering is announced at the November meeting and commences in November or December, might the Fed also use the November meeting to outline expectations for rate liftoff more clearly?
As illustrated in Exhibit 5, the market is ramping up expectations for a rate hike earlier in 2022 than previously expected, despite Fed comments that rates won’t move until the end of 2022 at the earliest.
After the September FOMC meeting, the expectation for an increase in the Federal Funds rate for June 2022 was 7.1%, and for the final meeting of 2022 in December was 38.5%, matching the Fed-speak. But at the end of October, expectations have pushed the first interest rate hike up sooner, with June 2022 showing a 38% chance of a rate hike and September 2022 showing a 52% chance.
Exhibit 5 – Rate Hike Expectations
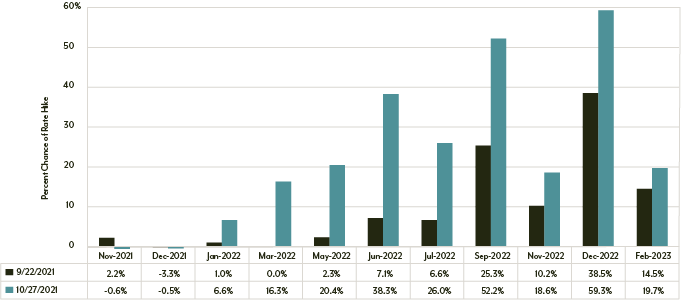
Source: Bloomberg.
Unlike after the global financial crisis of 2008, we do not have a clear roadmap of the Fed’s process for raising interest rates. Previously, the FOMC kept rates in the 0.00% to 0.25% range from 2009 until the final month of 2015 with clear communication about the process. This time is different as a global pandemic forced the Fed’s hand and put the world into unprecedented territory. As the Fed continues to unwind the historic stimulus and support, the market will be watching and listening closely for any kind of indication of next steps with regards to interest rates.
This reinforces our own philosophy and belief that predicting the path of interest rates is an unpredictable process that can result in unacceptable levels of volatility for clients’ fixed income portfolios. While we will monitor the potential future path of rates, we will not put our client’s money at risk based on the belief that we can predict something that has, time and again, shown its unpredictable nature.
SECTOR IN FOCUS – 2-Year Treasury
While not officially considered a sector, the 2-year treasury yield is a key metric utilized to interpret market expectations for near-term future interest rate expectations from the Federal Reserve.
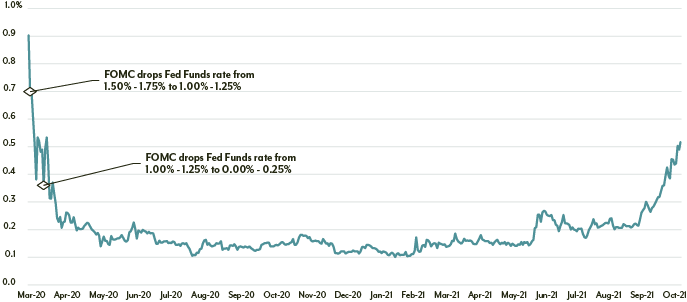
As the world entered the pandemic and nearly everyone went into lockdown, the FOMC acted in an unprecedented manner by lowering rates twice in a two-week period: a 50-basis point (bps) decrease on March 3 to a range of 1.00% to 1.25% and, in an emergency action, dropped the Fed Funds rate to the basement, a 100 bps decrease to a range of 0.00% to 0.25%.
From March 15, 2020, to the FOMC meeting on July 28, 2021, the average yield on the 2-year Treasury held steady at 16.5 bps. However, since the middle of summer, the yield on the 2-year Treasury has been steadily climbing higher. Since July 28 of this year, the yield on the 2-year Treasury has averaged 27 bps, roughly 63% higher than the previously mentioned average from March 2020 to the end of July 2021.
The biggest move occurred in late September after Federal Reserve officials indicated a sooner-than-expected rate increase in 2022 while also laying the groundwork to begin bond purchase tapering by year-end 2021. The yield on the 2-year Treasury finished the month of October at its highest level (0.50%) since the earliest days of the pandemic.
Outside of the obvious implications for future rate movements, an increasing yield on the short end of the Treasury curve makes it more attractive for investors to move out of money market funds and into relatively higher yielding short Treasuries.
2-YEAR TREASURY YIELD
Source: Bloomberg.
The views expressed are those of the author as of November 2021 and are subject to change without notice. These opinions are not intended to be a forecast of future events, a guarantee of future results, or investment advice. Investing involves risk, including the possible loss of principal. Past performance is not a guarantee of future results.