Securitization in Focus — June 2026
Headlines
Bust-out fraud makes headlines
A recent Bloomberg article highlighted the risks associated with bust-out fraud, in which fraudulent borrowers obtain multiple auto loans from various dealerships and lenders before new obligations appear in the credit reporting system.
The risk is amplified by two factors: lenders often wait roughly 30 days before reporting new loans to credit bureaus, and artificial intelligence has made it easier to fabricate income, employment and other supporting documents. The article cited one borrower who accumulated more than $700,000 in loans across at least 13 vehicles within a few weeks.
Why it matters for auto ABS: Most auto asset-backed securities (ABS) deals include loans with some seasoning, often three to four months of borrower payment history. That seasoning typically requires loans to be current at securitization and gives issuers time to identify early payment problems or potential fraud.
America’s Car-Mart works to avoid Chapter 11
America’s Car-Mart lenders agreed to waive defaults and events of default and provide covenant relief through early September, giving the struggling company additional time to determine a path forward. This is the latest in a series of extensions for one of the largest publicly held automotive retailers in the US, focused exclusively on the integrated auto sales and finance segment of the used-car market.
The company closed 42 dealerships in April, reducing its footprint from 136 dealerships to 94. America’s Car-Mart currently has five outstanding subprime auto ABS deals, all of which continue to pay down.
Why it matters for auto ABS: Securitizations are typically structured as bankruptcy-remote entities, meaning the outstanding ABS deals are not directly affected by the originating company’s potential financial challenges. Collateral performance remains in line with expectations, and delinquencies and losses remain contained. A potential servicer transfer, however, could be a drag on performance.
Consumer bifurcation continues
The unemployment rate has declined, and the economy continues to grow, though at a slower pace than many would prefer. A fragile Middle East peace agreement could reduce inflation pressure if energy and food prices move lower, but both remain a strain on household budgets.
Consumer spending remains resilient. Bank of America’s aggregated credit and debit card spending per household increased 5.1% year over year in May, the largest gain in nearly four years, following a 4.8% increase in April. Higher gasoline spending contributed to the strength, but spending excluding gas still rose 3.9% year over year in May, only modestly below April’s 4.0% increase.
Market implication: Consumer ABS performance has been mixed year-to-date. Borrowers at the lower end of the economic spectrum are showing more stress, while prime and higher-income consumers continue to perform better.
Spread volatility continues
Spreads continued to fluctuate with the changing geopolitical and interest rate environment. June performance was mixed, with some securitized sectors tightening while mortgages and corporate credit widened modestly.
|
Corporate Credit ABS |
Auto ABS |
Non-Agency CMBS |
Agency RMBS |
Investment Grade Corporates |
High Yield Corporates |
| Dec 31 2025 |
32.5 |
53.7 |
121.0 |
21.8 |
77.4 |
268.1 |
| Jan 31 2026 |
31.1 |
48.8 |
111.7 |
15.7 |
72.5 |
263.6 |
| Feb 28 2026 |
29.9 |
49.3 |
113.6 |
20.9 |
83.7 |
292.8 |
| Mar 31 2026 |
32.4 |
53.9 |
119.1 |
23.9 |
88.7 |
320.2 |
| Apr 30 2026 |
32.4 |
51.6 |
113.3 |
21.3 |
79.4 |
274.7 |
| May 31 2026 |
29.9 |
47.2 |
108.9 |
22.0 |
71.3 |
256.2 |
| Jun 30 2026 |
26.2 |
44.3 |
109.5 |
24.5 |
73.5 |
264.4 |
| Average |
30.7 |
49.8 |
112.9 |
20.5 |
77.4 |
274.4 |
Asset-Backed Securities
Credit-linked note issuance sets record pace
Credit-linked notes (CLNs) continue to emerge as an alternative financing structure, with $2.4 billion in deals priced year-to-date. These transactions are typically tied to pools of prime auto loans held on bank balance sheets, though other loan types may also be used.
CLNs allow banks to transfer credit risk on referenced loans to investors while keeping the assets on balance sheet. Issuers define a pool of loans, retain a portion of the risk and sell funded credit protection through the CLN structure. Investors receive a coupon but absorb losses if portfolio losses exceed the protected tranche.
For banks, the structure can reduce risk-weighted assets (RWAs) and improve Common Equity Tier 1 (CET1) efficiency, helping support lending capacity without requiring additional equity.
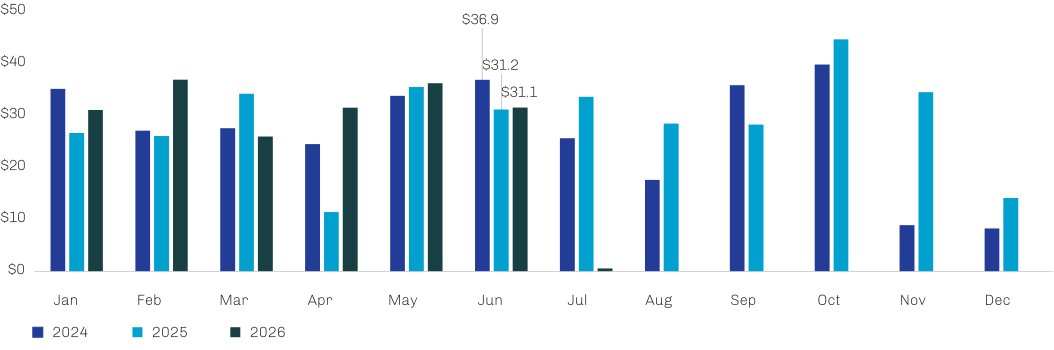
ABS issuance declined month over month, from $36.2 billion in May to $31.1 billion in June. Even with the decline, issuance over the past three months has averaged $33.0 billion, putting the market back on pace for another potential record year.
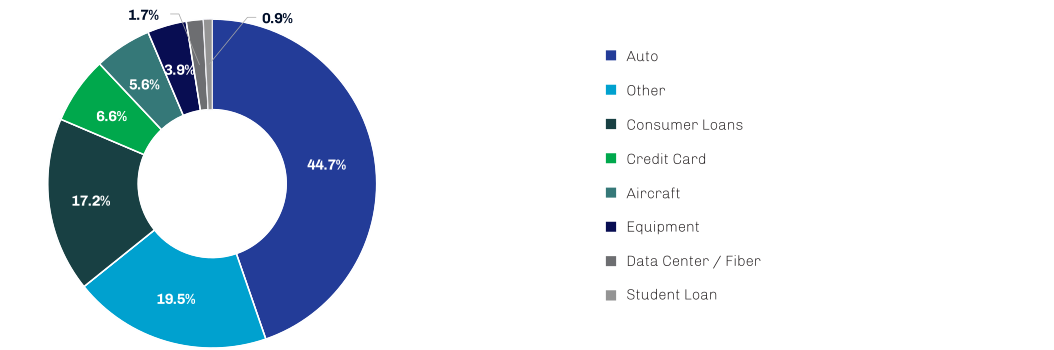
After rebounding from an early-year pause, credit-card ABS issuance was quiet again in June, holding year-to-date issuance at $6.2 billion. Overall 2026 ABS issuance now stands at $192.8 billion, well ahead of the same period in 2025 ($165.1 billion) and 2024 ($185.1 billion).
The 2024 comparison remains important, as issuance slowed meaningfully in the second half of last year, averaging roughly $22.7 billion per month over the final six months. Data center ABS ($2.1 billion), device payment and cellphone receivables ($1.2 billion) and fiber-optic ABS ($2.1 billion) all returned in June after pausing in May.
Monthly ABS Issuance (billions)
June ABS Issuance (%)
Commercial Mortgage-Backed Securities
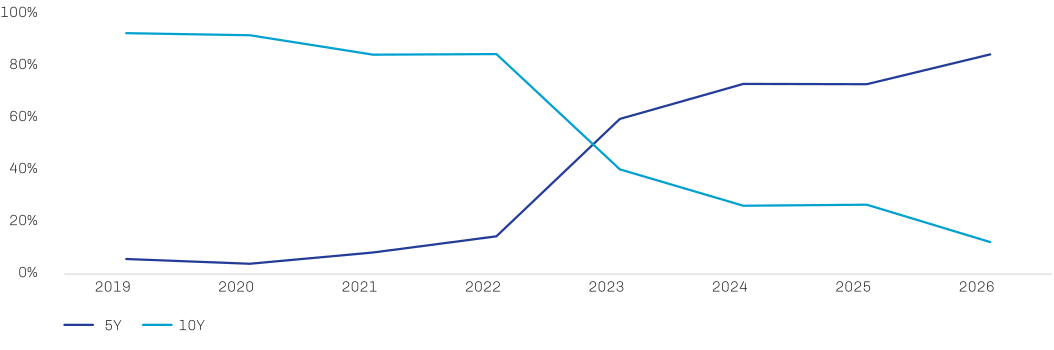
The 10-year conduit loan has long been a stalwart of the commercial mortgage-backed securities (CMBS) market. But after the 2022 rate reset, issuers increasingly shifted toward shorter terms amid concerns about higher borrowing costs and future refinancing risk.
The move toward 5-year conduit CMBS has been pronounced. Since 2019, the 10-year conduit share has fallen from 92.6% to 12.3% in 2026, while the 5-year conduit share has increased from 5.8% to 84.5% over the same period.
CMBS Conduit Issuance - Shift from 10Y to 5Y (% of balance)
The CMBS market recovery continued in June, with 2026 year-to-date production surpassing the comparable period in 2025: $89.3 billion vs $75.9 billion. Both periods remain well ahead of 2024’s $47.2 billion.
June production totaled $12.8 billion, the second-lowest monthly issuance level this year and only slightly ahead of April’s $12.7 billion. Single-Asset Single-Borrower (SASB) transactions continue to lead the market, with $7.9 billion in June issuance and $51.6 billion year-to-date, followed by conduit and commercial real estate collateralized loan obligations (CRE CLOs).
CMBS Trends in June
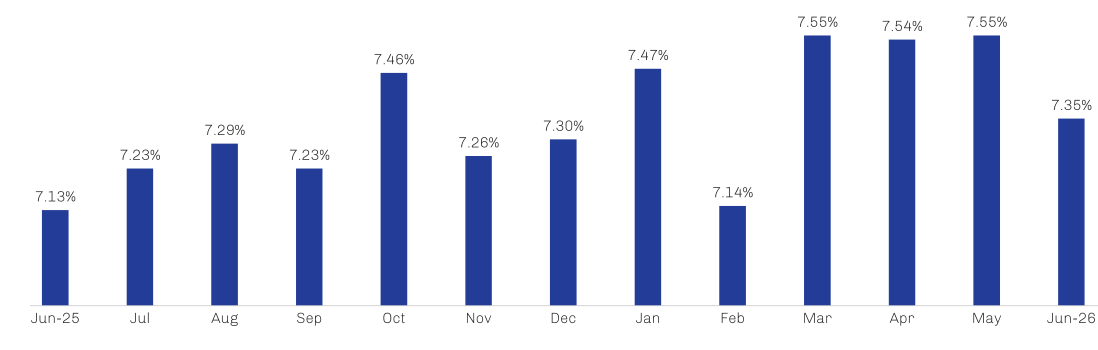
Overall CMBS delinquencies declined 20 basis points in June to 7.35%, extending the market’s up-and-down monthly pattern but with a larger decline than in recent months. Year over year, the CMBS delinquency rate increased 22 basis points, from 7.13% to 7.35%.
New delinquencies remained concentrated. The five largest newly delinquent loans accounted for $998.9 million of the $2.64 billion in newly delinquent loans, including a Southern California super-regional mall, a New Hampshire regional mall, a New York office complex, a Minneapolis mixed-use tower and a Manhattan multifamily property.
30+ Day CMBS Delinquencies (%)
At the property-type level, three of the five major categories weakened while two improved:
- Multifamily: up 28 basis points to 7.23%, as several large multifamily loans became delinquent
- Office: up 4 basis points to 11.57%
- Retail: up 30 basis points to 6.91%, as several large malls and outlet centers moved into delinquency
- Lodging: down 79 basis points to 5.22%, as one large prior-month delinquency cured in June
- Industrial: down 11 basis points to 1.20%
Seriously delinquent loans, defined as 60+ days past due, in foreclosure, real estate owned (REO) or nonperforming, decreased to 7.16% from 7.30% during the month.
Residential Mortgage-Backed Securities
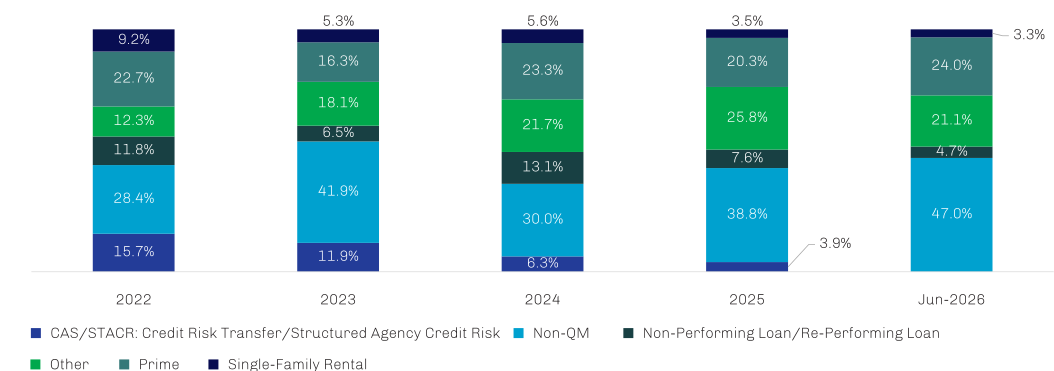
June issuance in the non-Agency RMBS market totaled $18.1 billion, nearly matching the year-to-date monthly average of $18.2 billion.
Non-qualified mortgage (non-QM) RMBS continues to dominate issuance, accounting for roughly 47% of June issuance, in line with the year-to-date share. Non-QM RMBS do not meet qualified mortgage guidelines set by the Consumer Financial Protection Bureau and typically offer more flexibility in borrower eligibility and documentation criteria.
The “other” category, which includes home-equity loans, home-equity lines and reverse mortgages, delivered $3.8 billion in June issuance. Year-to-date issuance in the category now totals $24.0 billion, representing roughly 22% of all non-Agency RMBS issuance in 2026.
Non-Agency RMBS Issuance
Sources: Deutsche Bank, Bloomberg, Trepp.
See diamond-hill.com/disclosures for a full copy of the disclaimer.
The views expressed are those of Diamond Hill as of July 2026 and are subject to change without notice. These opinions are not intended to be a forecast of future events, a guarantee of future results or investment advice. Investing involves risk, including the possible loss of principal. Past performance is not a guarantee of future results.