Geopolitics Rewrite the Rate Narrative
June was marked by several notable developments: the start of the 2026 FIFA World Cup across the United States, Canada and Mexico, a temporary ceasefire in the Middle East, the first Federal Open Market Committee (FOMC) meeting chaired by someone other than Jerome Powell in eight years and a renewed shift toward a more hawkish Federal Reserve amid resurgent inflation. While the World Cup has provided memorable moments—including Norwegian supporters "Viking rowing" from stadiums to subway cars to airplanes—this commentary focuses on the developments shaping financial markets.
A Volatile Ride for Energy
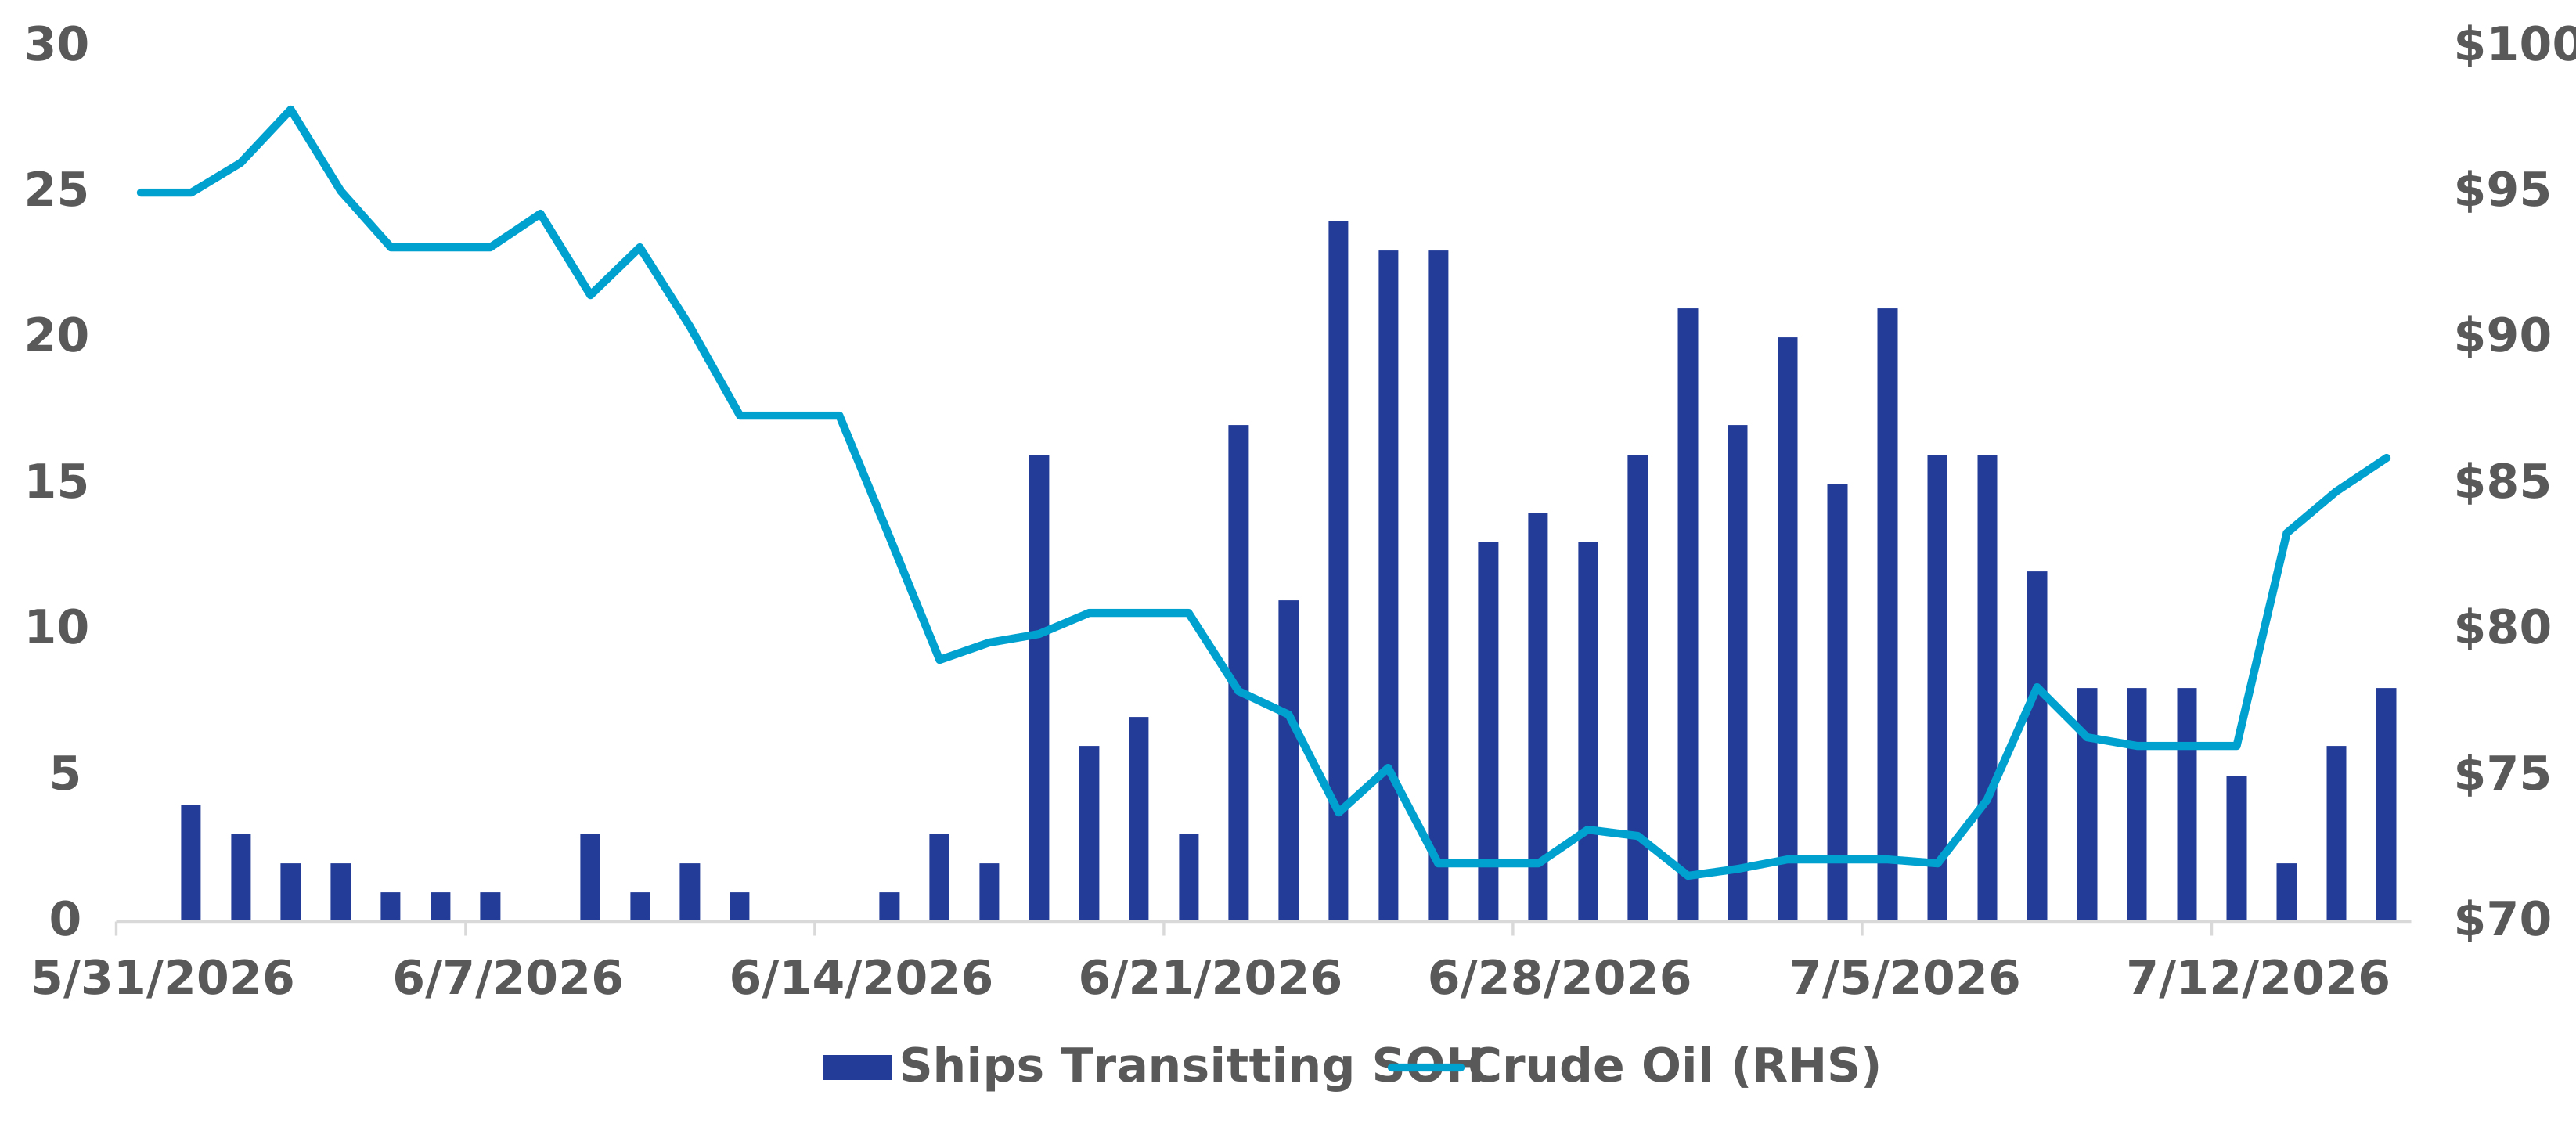
More than 100 days after the Middle East conflict began, the US and Iran agreed to the 14-point Islamabad Memorandum of Understanding (MOU), initiating a 60-day ceasefire intended to lay the groundwork for a broader peace agreement. Reactions were mixed, as a $300 billion reconstruction fund for Iran rattled US constituents, and the limits on nuclear development did not sit well with the Iranian people. Despite having the MOU in place and talks actively underway between the US and Iran (with Qatar and Pakistan mediating), drone and retaliatory missile attacks continued, as did the war of words from President Trump. The number of ships moving through the Strait of Hormuz (SOH) ramped up as the ceasefire took hold, and consequently Brent crude oil prices dropped significantly. With small skirmishes continuing to flare up, the US and Iran agreed again to halt attacks, which held for about a week. By the end of the first week of July, missiles and drones were once again flying across the skies of the Middle East, the SOH was closed by Iran, the US reinstituted an Iranian naval blockade and the MOU has become little more than another piece of paper. As a result, energy prices spiked as hopes for a lasting ceasefire faded.
Exhibit 1. Strait of Hormuz Ship Count & Brent Crude Price
Source: Bloomberg; data as of July 15, 2026.
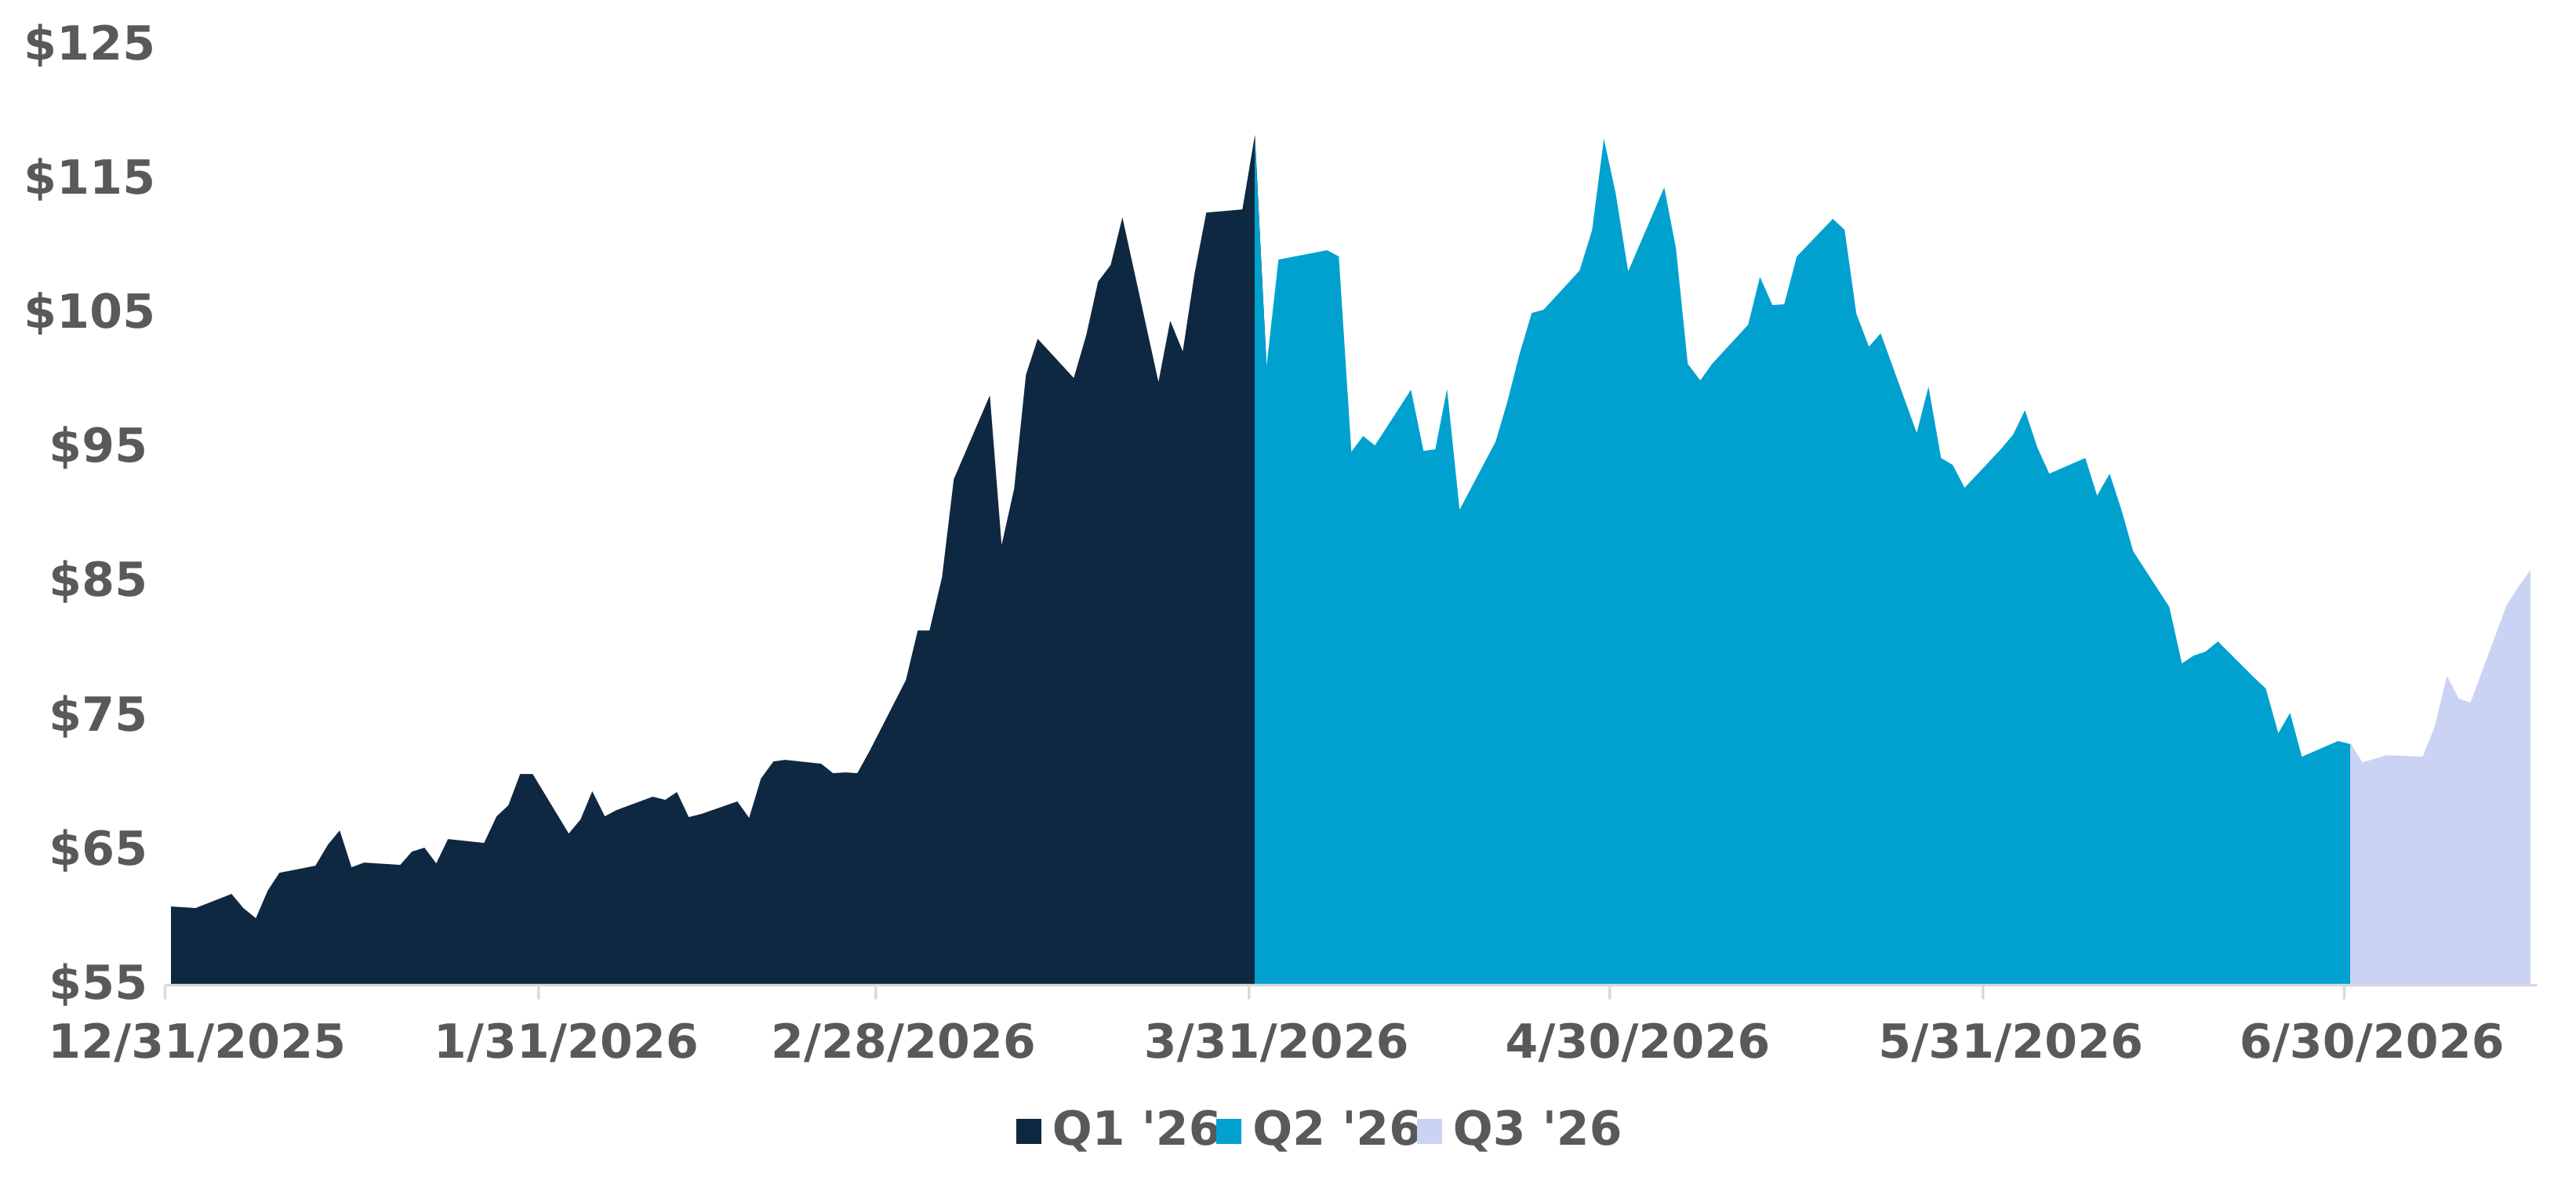
The first quarter of 2026 saw the largest quarterly jump in the price of Brent crude since the Gulf War in 1990, followed by the biggest quarterly decline since the pandemic began in early 2020. Volatility in energy markets was indicative of overall volatility in financial markets, with fears of an expanding conflict ebbing and flowing with each bit of news out of the Middle East.
Exhibit 2. Brent Crude Rollercoaster
Source: Bloomberg; data as of July 15, 2026.
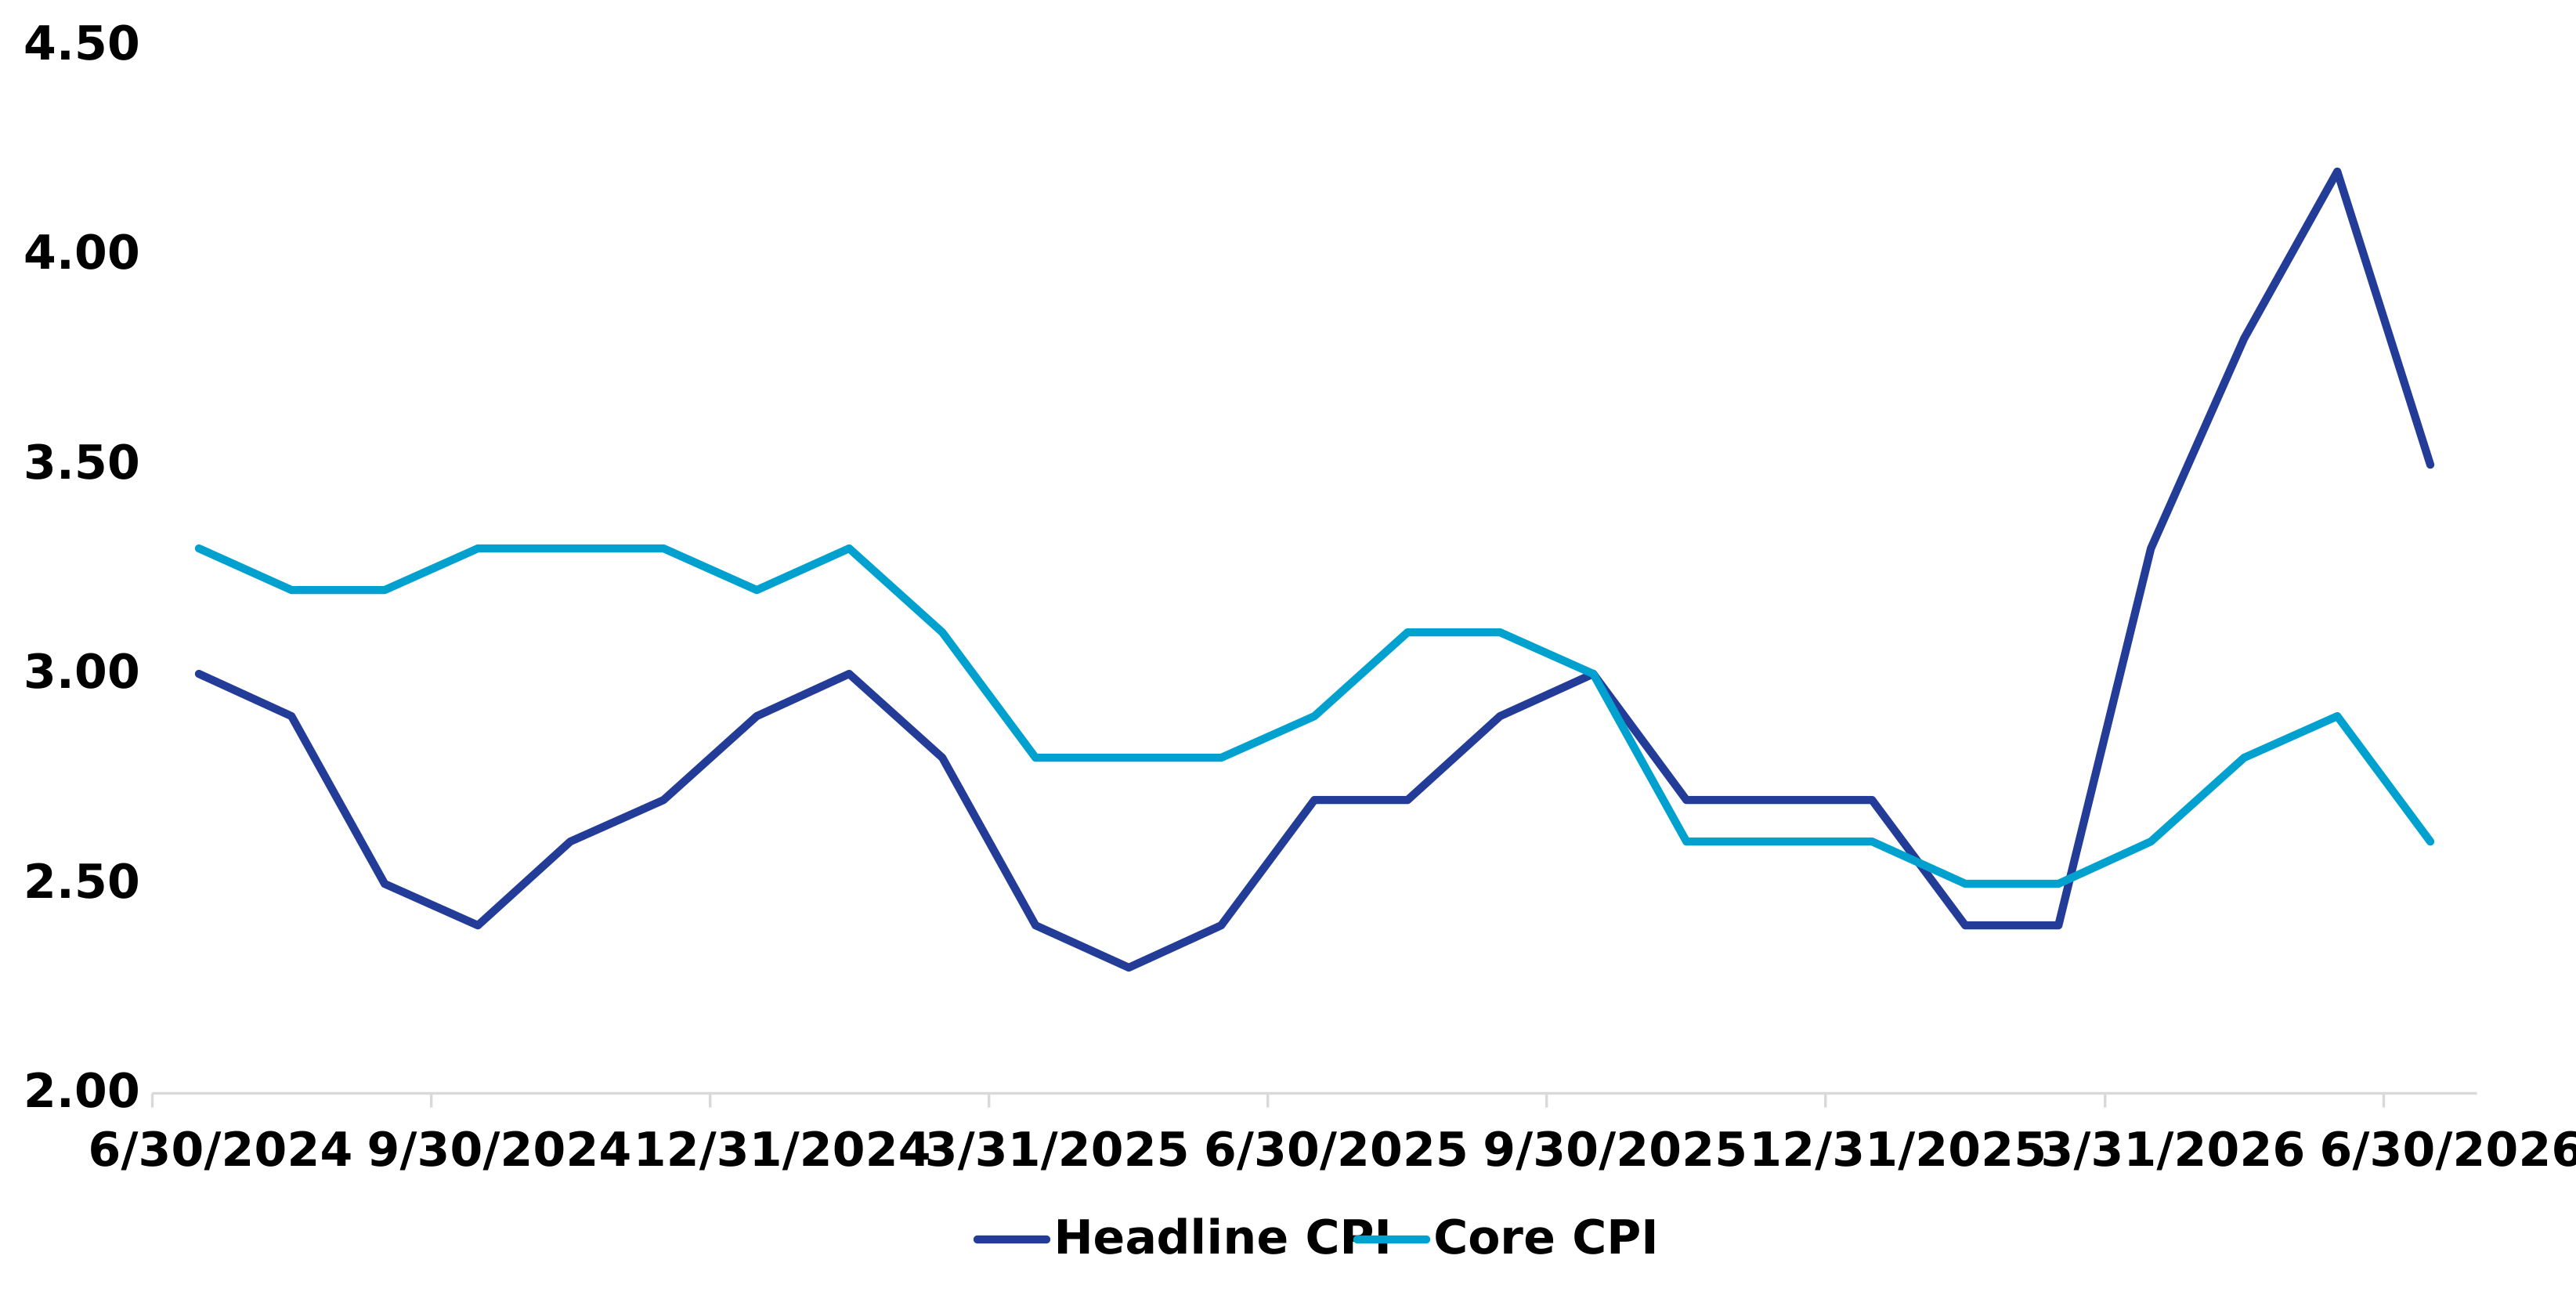
Volatility in crude oil quickly flowed through to inflation expectations. Headline and core inflation stabilized throughout 2024 before gradually declining in 2025 and into early 2026. The spike in energy prices associated with the Middle East conflict reversed that trend, pushing headline inflation sharply higher through May before June's decline in crude oil prices produced a partial reversal. Lower energy prices throughout the second quarter have already begun to feed through to inflation, with 12-month headline Consumer Price Index (CPI) dropping from 4.2% (May 2026) to 3.5% (June 2026) and core CPI declining from 2.9% (May 2026) to 2.6% (June 2026).
However, the market should hold off from any kind of celebration, as renewed hostilities and higher energy prices could push future inflation calculations higher. Although Federal Reserve officials would likely avoid describing the recent inflation pickup as transitory, the term arguably fits given that much of the recent volatility has been driven by energy prices rather than broad-based inflationary pressures.
Exhibit 3. Core & Headline Inflation Divergence
Source: Bloomberg; data as of June 30, 2026.
The Road Ahead for Rates
The first FOMC meeting under Kevin Warsh’s leadership shifted from former Chair Powell’s very open, communicative process to a less verbose press conference with less emphasis on future guidance. Markets entered 2026 expecting two rate cuts, but those expectations held only through February before conflict in the Middle East shifted sentiment from dovish to neutral and, as energy prices continued to rise and the Strait of Hormuz remained closed, ultimately to hawkish. Fed fund futures peaked on July 13 on news that the Iranian blockade by the US Navy had resumed and Iran claimed it targeted US bases in Oman. Futures on that day implied 10.8 basis points in hikes at the July 29 meeting, 25.8 basis points by the September meeting and 42.8 basis points by the December meeting. Since then, markets have recalibrated, dialing back expectations to cumulative 26.2 basis points by year end.
Right or wrong, inflation and interest rate expectations are going to be influenced with each bit of news out of the Middle East and any signs the conflict may be nearing resolution. Today, credit spreads across investment-grade, high-yield and securitized markets remain near their tightest levels year to date, and whether the current inflation trajectory ultimately proves temporary or more persistent will depend largely on developments in the Middle East, and until greater clarity emerges, markets are likely to remain highly sensitive to geopolitical headlines.
In this environment, disciplined security selection and a thorough understanding of underlying credit fundamentals remain the most effective tools for navigating elevated volatility.
Exhibit 4. Spread Levels: December 2025 to June 2026 (in basis points)
| |
Bloomberg US Aggregate Bond Index |
Bloomberg US Corporate Bond Index |
Bloomberg US Securitized Index |
Bloomberg US Corporate High Yield Bond Index |
|
December 2025
|
26.9 |
77.5 |
25.2 |
266.4 |
| January 2026 |
24.1 |
72.9 |
19.1 |
265.1 |
| February 2026 |
27.9 |
84.4 |
24.0 |
291.0 |
| March 2026 |
30.5 |
88.6 |
27.0 |
317.0 |
| April 2026 |
25.6 |
78.4 |
23.3 |
267.6 |
| May 2026 |
25.0 |
71.8 |
24.8 |
257.5 |
| June 2026 |
26.3 |
74.2 |
27.0 |
269.7 |
| 10-year Average |
42.9 |
110.8 |
40.7 |
374.5 |
Source: Bloomberg; data as of June 30, 2026.
Headline CPI measures the overall change in consumer prices across the full basket of goods and services. Core CPI is headline CPI excluding food and energy.
Investment Grade is a bond quality rating of AAA, AA, A or BBB. Yield to Worst (“YTW”) is the lowest potential bond yield received without the issuer defaulting; it assumes the worst-case scenario, or earliest redemption possible under terms of the bond.
Index data source: Bloomberg Index Services Limited. See diamond-hill.com/disclosures for a full copy of the disclaimer.
The views expressed are those of the author as of July 2026 and are subject to change without notice. These opinions are not intended to be a forecast of future events, a guarantee of future results or investment advice. Investing involves risk, including the possible loss of principal. Past performance is not a guarantee of future results.