Taxable Fixed Income Markets Update: April 2026
The war with Iran continued to dominate fixed income markets in April, with asset prices moving in conjunction with waxing and waning hopes for a swift end to the conflict. Though the month ended with the combatants in an extended cease-fire, a peace agreement has been elusive and the Strait of Hormuz remains effectively closed. Markets appeared to grow accustomed to this new normal, however, and spread assets in general delivered returns in excess of Treasuries.1
Treasuries and rates. The specter of a prolonged conflict with Iran weighed on Treasuries and sent yields higher across the curve. Given the war’s potential inflationary impact, longer-maturity bonds were the most effected; yields on 10- and 30-year Treasuries, for example, both moved to levels not seen consistently since the first half of 2025.2 Meanwhile, futures markets, which entered the year pricing in two or three fed rate cuts during 2026, now expect no policy rate action by the central bank.3
Corporate credit. Having spiked with the outbreak of hostilities with Iran, investment grade and high yield corporate spreads tightened to end-2025 levels during April as markets brushed off the challenging geopolitical environment. Both delivered strong excess returns relative to comparable-duration Treasuries.4 Corporate issuance across the credit spectrum remained robust during the month and is running more than 28% higher compared to year-to-date 2025.5
Securitized credit. As they did in other credit segments, securitized credit spreads tightened throughout April. Unlike other areas of the market, however, securitized credit spreads now sit tighter than end-2025 levels. Index-level performance returned to positive territory in April, helped by shorter-duration asset-backed securities. Though not part of the Bloomberg family of indexes, collateralized mortgage obligations were the top-performing sector of the securitized market.6
Corporate Spreads Back to Where They Began 2026
Bloomberg US Corporate Bond Index Spread in Basis Points, April 2025 through April 2026
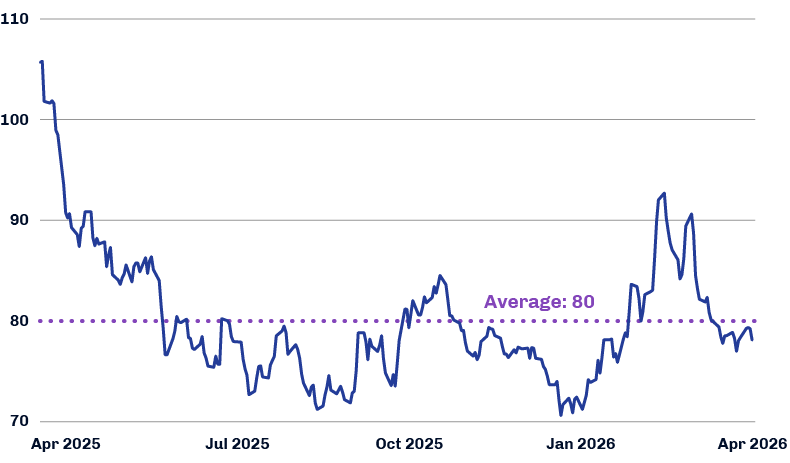
Source: Bloomberg; data as of May 7, 2026.
1 Source: Bloomberg; data as of April 30, 2026.
2 Source: Federal Reserve Bank of St. Louis; data as of April 30, 2026.
3 Source: Bloomberg; data as of April 30, 2026.
4 Source: Bloomberg; data as of April 30, 2026.
5 Source: SIFMA; data as of April 30, 2026.
6 Source: Bloomberg, Intercontinental Exchange; data as of April 30, 2026.
Bloomberg US Corporate Bond Index measures the performance of the US investment grade fixed-rate taxable corporate bond market.
The views expressed are those of the author as of May 2026 and are subject to change without notice. These opinions are not intended to be a forecast of future events, a guarantee of future results or investment
advice. Investing involves risk, including the possible loss of principal. Past performance is not a guarantee of future results.