Fixed Income Monthly Commentary — October 2020
It’s no secret that yield curves globally are probing historic territory, pushing past previous record lows as the pandemic took hold. A quick glance at Exhibit 1 shows clearly the issue with government debt. Three countries (Germany, Switzerland and the Netherlands) have negative-yielding debt across their entire curves.
EXHIBIT 1: GLOBAL GOVERNMENT INTEREST RATES
| REGION |
2-YEAR |
3-YEAR |
5-YEAR |
7-YEAR |
10-YEAR |
15-YEAR |
30-YEAR |
| EMEA |
| United Kingdom |
(0.04) |
(0.08) |
(0.04) |
0.06 |
0.26 |
0.49 |
0.83 |
| France |
(0.73) |
(0.74) |
(0.70) |
(0.58) |
(0.34) |
(0.18) |
0.35 |
| Germany |
(0.80) |
(0.85) |
(0.82) |
(0.76) |
(0.63) |
(0.45) |
(0.22) |
| Italy |
(0.35) |
(0.26) |
0.19 |
0.41 |
0.76 |
1.09 |
1.59 |
| Spain |
(0.59) |
(0.54) |
(0.33) |
(0.17) |
0.13 |
0.44 |
0.93 |
| Portugal |
(0.61) |
(0.53) |
(0.41) |
(0.19) |
0.10 |
0.46 |
0.80 |
| Sweden |
(0.47) |
|
(0.44) |
|
(0.13) |
|
|
| Netherlands |
(0.78) |
(0.79) |
(0.76) |
(0.68) |
(0.52) |
(0.45) |
(0.13) |
| Switzerland |
(0.86) |
(0.87) |
(0.80) |
(0.71) |
(0.58) |
(0.43) |
(0.37) |
| Greece |
0.10 |
|
0.31 |
0.54 |
0.91 |
1.13 |
|
| Asia/Pacific |
| Japan |
(0.14) |
(0.14) |
(0.10) |
(0.09) |
0.03 |
0.24 |
0.64 |
| Australia |
0.10 |
(0.11 |
0.28 |
0.50 |
0.82 |
1.11 |
1.77 |
| New Zealand |
(0.04) |
|
0.01 |
0.17 |
0.52 |
0.97 |
|
| South Korea |
0.83 |
|
1.23 |
|
1.53 |
|
|
| China |
2.84 |
2.93 |
3.02 |
3.24 |
3.17 |
|
3.86 |
Source: Bloomberg, as of 10/31/2020.
Germany's 10-year bund first pushed into negative territory in 2016 when the ECB began purchasing corporate debt in an effort to support the European economy and corporate market. After initially dropping below zero, the 10-year yield reached as high as 0.76% near the end of 2017 before a rally that pushed the rate into negative territory once more in early 2019. Since then, the bund rate has not reached higher than -0.17%, as low as -0.86% during the peak of COVID-related volatility in late March.
EXHIBIT 2: 10-YEAR GERMAN BUND YIELD
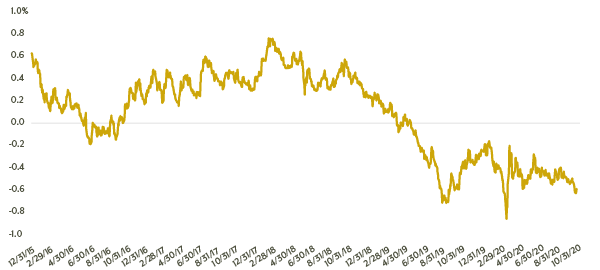
Source: Bloomberg, as of 10/31/2020.
Exhibit 2 is startling, but even more so when one considers the amount of negative-yielding debt as well as the fact the negative-yield phenomenon has spread beyond government debt to corporate debt and other market areas. In fact, the total market value of the Bloomberg Barclays Global Aggregate Bond Index (which measures all major markets in investment grade fixed income) is $65.0 trillion as of October 31, 2020, with more than $16.5 trillion currently in negative-rate territory. That negative portion is still dominated by higher quality government debt (85.8% of the negative-yielding securities), but securitized debt represents 7.8% and corporate debt 6.4%. Negative-yielding corporate debt ramped up fairly quickly once European governments launched their asset purchase programs.
Previously, the average percentage of negative yielding debt relative to the overall index was rather benign—averaging roughly 1% from 2010 until the beginning of 2016 (Exhibit 3). Once asset purchase programs were launched, the percentage of negative yielding debt averaged 18.8% from 2016 to the most recent month-end level of 25.3%, with a low of 11.7% and a maximum of 30.2%.
EXHIBIT 3: PERCENT OF NEGATIVE-YIELDING DEBT IN GLOBAL MARKETS
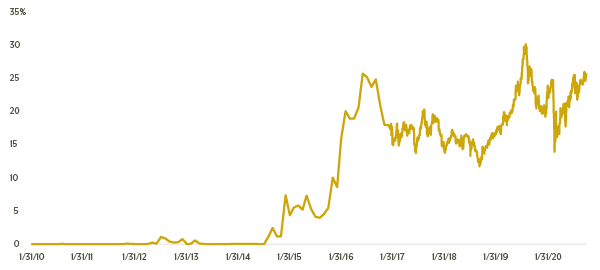
Source: Bloomberg, as of 10/31/2020.
And negative yields are weighing on the global market, with the Bloomberg Barclays Global Aggregate index delivering a yield to worst of 0.91% with a duration of 7.37 years as of October 31, 2020. The question is: Where does an investor turn in order to generate some yield
Searching the U.S. Markets for Yield
With the Federal Reserve making it very clear that the shorter end of the Treasury curve will be anchored in the “lower for longer” position, expectations for a breakout on the longer end are muted. Inflation is currently running at 1.4%, which means that the ten-year Treasury yield of 0.87% (Exhibit 4) would result in negative real yield.
Moving out to the 30-year Treasury would result in real yield but would also mean assuming significant duration risk. The 30-year Treasury was yielding 1.66% at the end of the month, providing 0.26% real yield for a significant amount of interest rate risk.
EXHIBIT 4: U.S. TREASURY YIELDS
| TENURE |
YIELD |
| 2-year |
0.15% |
| 3-year |
0.20 |
| 5-year |
0.38 |
| 10-year |
0.87 |
| 20-year |
1.43 |
| 30-year |
1.66 |
| Inflation |
1.40 |
Source: Bloomberg, as of 10/31/2020.
An investor could look to the investment grade corporate space, adding credit risk in an effort to outpace inflation and deliver real positive yields. The ICE BofA Corporate Index has continually compressed since the Federal Reserve announcement of both the primary and secondary market corporate credit facilities (PMCCF and SMCCF) in late March and early April. The facilities have been so effective in bringing stability to the corporate market that the index’s yield to worst has now dropped below pre-COVID levels, hovering near or below 2% since late July. At the same time, corporate debt market issuance has reached records levels. The ICE BofA Corporate Index offers relatively attractive real yield relative to Treasuries, but that advantage comes with a longer effective duration of 8.30 years. Investors not willing to reach out further in duration could opt for the ICE BofA 1-3 Year Corporate Index, shortening duration to 1.87 years but also reducing the yield to 0.79%, well below inflation.
So, where can an investor pick up additional yield without having to move so far out on the yield curve? With support from the aforementioned primary and secondary market facilities, the high yield corporate market has followed a similar trajectory as the investment grade corporate space. The main difference between the two is that while the high yield market yield to worst has continued grinding tighter, the duration of the index has remained fairly stable (Exhibit 5), reflecting the shorter term nature of high yield debt. The ICE BofA High Yield Index has a yield to worst of 5.75% and a duration of 4.03 years at the end of October, offering an attractive opportunity to pick up yield without extending much further than where the index was at the beginning of the year.
EXHIBIT 5: CHANGE TO YIELD TO WORST AND DURATION
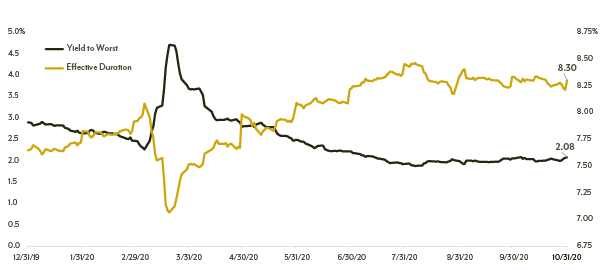
Source: Bloomberg, the ICE BofA Corporate Index, as of 10/31/2020.
There’s no free lunch, as we all know, and the additional yield in the high yield market is based on the perceived risk of high yield assets over investment grade. As we established, the additional risk isn’t in duration as the high yield index is considerably shorter than its investment grade counterpart. High yield carries the stigma of its own legacy, previously being referred to as “junk bonds” when they first came to prominence in the mid-1980s. But the market has evolved over the years to become a sizable ($1.4 trillion), diverse (2,015 issues in the ICE BofA High Yield Index) and liquid market, offering attractive return potential for investors willing to dip below the investment grade threshold. Electronic trading platforms like TruMid and MarketAxess have streamlined the trading process and brought the ability to quickly adjust a portfolio during times of volatility.
The risk most closely associated with the high yield market is credit risk. And given the current state of the global economy, fears of a 2008-2009-like explosion in defaults in corporate America have risen. While default rates ramped in the early days of the pandemic, peaking at 8.7% in August, the trailing 12-month default for high yield bonds and loans declined to 8.5% during September. Moody’s had forecast 11.2% in early April and defaults averaged roughly 20 per month from April to July. But, in August and September, Moody’s reported only 11 defaults combined, with October trending in the same direction. This doesn’t mean that the market is out of the woods, far from it. But with the PMCCF and SMCCF extended past the September 30 deadline to the end of the year, and with only 5% of the allotted $750 billion allocated to the programs actually utilized to purchase bonds and ETFs, there is quite a bit of dry powder support for the credit markets. Also, consider that the high yield market has issued more debt over the past two quarters than at any other time in its history and, despite that influx of supply, demand was more than adequate to continue pushing spreads and yields lower. Firms are shoring up balance sheets and building reserves with new issuance, ready to tackle potential volatility.
From a historic standpoint, the high yield market yield to worst is significantly lower than its historic average (5.75% vs. 8.37%, according to Bloomberg), but that difference cannot be taken at face value. Relative to other assets classes available in the fixed income market, high yield securities offer an advantage in both yield pick-up and lower duration, outpacing inflation without moving too far out on the curve and picking up interest rate risk. But it is not sufficient to simply allocate funds to the high yield market and clip the coupon. Investors need to employ managers that are willing to “stand out by not fitting in,” utilizing advantages in execution and analytical edge to find the right combination of securities that can deliver excess returns.
This material is for informational purposes and is prepared by Diamond Hill Capital Management. The opinions expressed are as of the date of publication and are subject to change. These opinions are not intended to be a forecast of future events, the guarantee of future results or investment advice. Reliance upon this information is in the sole discretion of the reader. Investing involves risk, including the possible loss of principal.