What a Difference a Year Can Make — How About 5 Years?
In the investment management world, evaluating managers and their products is critical in determining proper fit for investors. One element of that evaluation is past performance, but how does one select the proper time frame for conducting an evaluation? A lot can happen in the market over a three, five or ten-year time period. Market cycles and gyrations in the global economy don’t care about calendars or standard time periods—in fact, the past five years have encompassed so many events and challenges it’s analogous to looking back at 100 years of market history.
When I joined Diamond Hill, along with portfolio managers Henry Song, CFA, and Mark Jackson, CFA, the most frequent barrier to acceptance of our investment strategies was, “How long is your track record?” Faced with more closed doors than open ones, we focused on our work, slowly building the asset base of our strategies with those willing to look past a shorter track record. Henry and Mark managed the strategies using an investment philosophy and process that dates back to the mid-1980s, while I traveled the country spreading the word of their efforts and our new venture.
Now, five years later, we’re able to check off multiple boxes for those interested in our philosophy and process. More than $500 million in each our strategies? Check. As of June 30, 2021, assets in our Short Duration Securitized Bond and Core Bond strategies totaled $1.3 billion and $600 million, respectively. Three- and five-year track records? Check. Continued growth of the fixed income team? Check, thanks to the addition of structured analysts Wenting He and Charlie Minor, CFA. New strategies being launched? Check. Unwavering support from senior management and other areas of the firm? Check.
But beyond all the check marks and significant anniversaries, it is important to look back on our first five years at Diamond Hill to truly understand what kind of markets we’ve been managing through. I would argue these past five years encompass some of the most dynamic times in the markets, outside of the turmoil generated by Long Term Capital Management’s demise in 1998 and the Global Financial Crisis of 2008.
Treasury Market
The Diamond Hill Short Duration Securitized Bond and Core Bond strategies launched on July 5, 2016, just as markets were emerging from the shadows cast by the initial Brexit vote. The uncertainty around the U.K.’s departure from the European Union resulted in a flight to quality that pushed the yield on the 10-year Treasury to, at the time, an all-time low rate of 1.36% on July 8. Since that time, the Treasury market has experienced a backup in yields fueled by ongoing economic expansion that pushed the 10-year Treasury to a peak level of 3.24% on November 8, 2018, before cratering to new all-time lows as the COVID-19 pandemic shut down global financial markets and the world.
The shorter end of the yield curve, specifically the 2-year Treasury, has experienced the same trajectory, rising from the lows of mid-2016, peaking in late 2018 and collapsing in early 2020 (Exhibit 1). Unlike recent movements in the 10-year and 30-year Treasuries, the 2-year Treasury remains anchored, reflecting the Federal Reserve’s intention to keep short-term rates suppressed until they have unwound or tapered the balance sheet.
Exhibit 1 – Treasury Yields
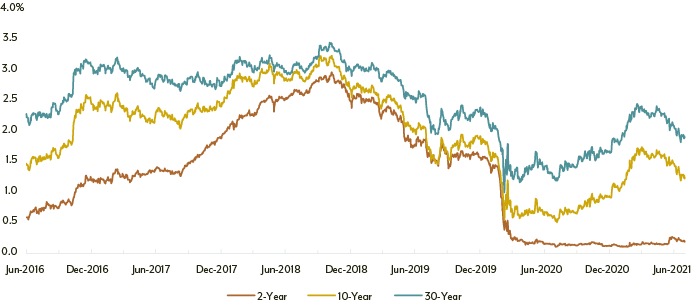
Source: Bloomberg.
From a yield curve perspective, the past five years have seen a flattening of the curve from June 2016 to year-end 2018, followed by a return to more standardized yield curve positioning by the end of July 2021. Specifically, the difference in yield between the 10-year Treasury and the 2-year Treasury at the end of June 2016 was 89 basis points (bps), providing a pickup in yield further out on the curve. This difference compressed to 20 bps at the end of 2018 as the Federal Reserve accelerated its tightening campaign, raising the Federal Funds rate 25 bps four times, following up on three 25 bps increases in 2017 and pushing the yield of the 2-year Treasury to 2.49% at year-end 2018. At the end of July 2021, the spread between to 2-year and 10-year Treasuries was 103.8 bps.
Exhibit 2 – Yield Curve Shifts
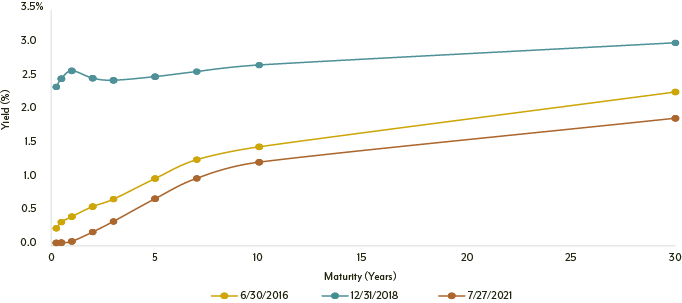
Source: Bloomberg.
Fluctuations in the Treasury market serve as reinforcement of the notion that predicting interest rate movements is incredibly challenging and being able to do so on a consistent basis over long periods of time is nearly impossible. Given what we experienced in the first half of 2021—with the 10-year Treasury increasing 82.6 bps in Q1 followed by a reversal in Q2 (down 27 bps)—putting clients’ money at risk by trying to predict interest rate movements can result in volatility that is not desirable in a core fixed income allocation.
Duration Extension and Spread Compression
One of the most notable changes that occurred over the past five years in the investment grade fixed income market is the duration extension in the corporate market, which has contributed to the extension of the duration of the Bloomberg Barclays U.S. Aggregate Bond Index. Specifically, the duration of the Bloomberg Barclays U.S. Corporate Bond Index had been range bound between 7.0 to 7.5 years leading up to 2019 but has spent the last two and a half years on a rising trajectory to its current near-record level of 8.75 years. Over the same period, the yield earned in the corporate bond market over comparable duration Treasuries has continued to compress to near record low levels.
Outside of the volatility that occurred during the early part of 2020 as markets dealt with the impact of the COVID-19 pandemic, spreads have remained historically low while duration levels have climbed. (Recall that duration is the measurement of a bond’s or portfolio’s sensitivity to interest rate movements. A duration of 8.75 years means that a portfolio will gain/lose 8.75% for every 100 bps move lower/higher. This is best illustrated by the impact of rate movements in Q1 and Q2 of 2021.)
This combination of duration extension and spread compression has created an investment grade market that carries with it significant interest rate risk with minimal spread advantage. The first quarter of 2021 is reflective of this impact as an increase in the 10-year Treasury yield of nearly 83 bps hit investment grade credit particularly hard, with the index losing 4.65%.
Loss (or return) for a fixed income investment can be broken down into two components—price and coupon. While the coupon return for the Bloomberg Barclays U.S. Corporate Bond Index consisted of 0.80% in Q1, the price loss of -5.44% illustrates the risk associated with longer duration with a minimal coupon or yield offset. In other areas of the investment grade market, the Treasury index duration extended from 6.42 years to 7.13 years over the past five years and while not as significant as the extension in the investment grade corporate market, it still helped push the overall index higher by more than a year (Exhibit 4).
Exhibit 3 – Duration and OAS Compression of the Bloomberg Barclays U.S. Corporate Bond Index
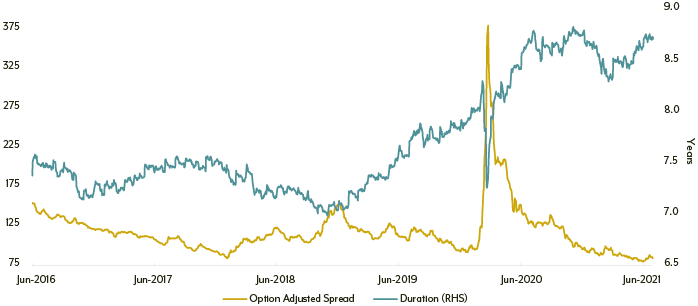
Source: Bloomberg.
Exhibit 4 – Duration Extension and OAS Compression of the Bloomberg Barclays U.S. Aggregate Bond Index
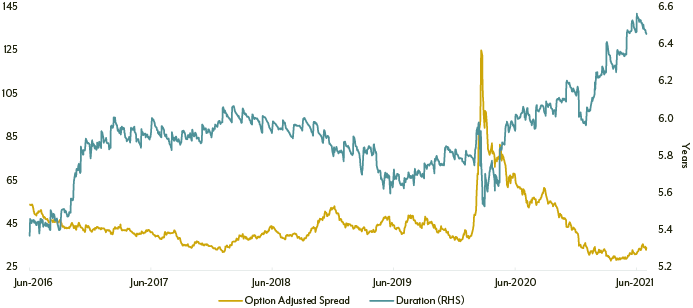
Source: Bloomberg.
Federal Reserve Actions
Five years ago, the Federal Reserve was in the early stages of its quest to move rates off the range of 0.00% to 0.25%, having increased the Federal Funds rate 25 bps or 0.25% in December 2015—the first change of any kind since December 2008. What followed the initial increase in 2015 was a single increase in December 2016, three more 25 bps increases during calendar year 2017, and four additional increases of the same amount in 2018. The tightening phase from December 2015 to December 2018 brought the range of the Fed Funds rate to 2.25% to 2.50%, its highest level since March 2008.
With the economy slowing and trade war rhetoric ramping up, the Federal Reserve implemented three rate cuts in 2019 and held steady at 1.50% to 1.75%, before rapidly bringing rates down to 0.00% to 0.25% as COVID-19 took hold of the world and shut everything down.
Exhibit 5 – Federal Funds Rate
| 7/5/2016 |
0.25 - 0.50% |
|
Clearly communicated and orchestrated lift off from zero coming out of the financial crisis. Remained at 0.00% to 0.25% from 12/16/08 until the start of the tightening cycle in December 2015, increasing by 25 bps increments until gradual slowdown of economy in 2019. |
| 12/14/2016 |
0.50 - 0.75% |
+25 bps |
| 3/15/2017 |
0.75 - 1.00% |
+25 bps |
| 6/14/2017 |
1.00 - 1.25% |
+25 bps |
| 12/13/2017 |
1.25 - 1.50% |
+25 bps |
| 3/21/2018 |
1.50 - 1.75% |
+25 bps |
| 6/13/2018 |
1.75 - 2.00% |
+25 bps |
| 9/26/2018 |
2.00 - 2.25% |
+25 bps |
| 12/19/2018 |
2.25 - 2.50% |
+25 bps |
| 7/31/2019 |
2.00 - 2.25% |
-25 bps |
Trade war, slowdown in economic growth, “insurance” to keep economy on track. |
| 9/18/2019 |
1.75 - 2.00% |
-25 bps |
| 10/30/2019 |
1.50 - 1.75% |
-25 bps |
| 3/3/2020 |
1.00 - 1.25% |
-50 bps |
COVID-19 |
| 3/15/2020 |
0.00 - 0.25% |
-100 bps |
Source: Bloomberg.
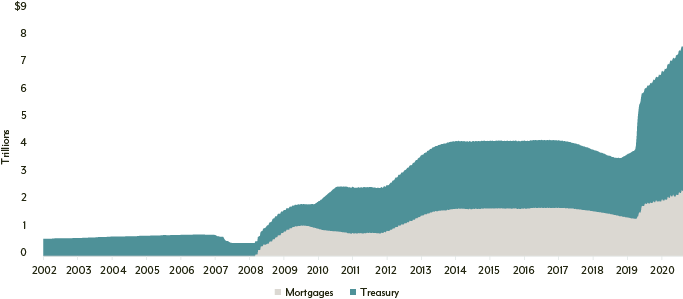
Coming out of the 2008 Global Financial Crisis, the Fed’s Treasury holdings were steady at just below $500 billion but grew to nearly $2.5 trillion at the end of 2015 with an additional $1.7 trillion in agency mortgage-backed securities (MBS) due to a variety of quantitative easing programs.
But this increase was nothing compared to what began in March 2020 as the Fed unleashed multiple programs to support the U.S. economy and consumer as the pandemic took hold, pushing its balance sheet to more than $5.2 trillion in Treasuries and $2.4 trillion in Agency MBS. The Fed’s actions helped re-open financial markets that had, for all intents and purposes, completely shut down. In 2008, markets were uneven and volatile, but they were still functioning. The market had concerns about counterparty risk (Bear Stearns, Lehman Brothers) and the outlook for the overall economy, but investors could continue to trade and work with brokers.
Exhibit 6 – Fed Balance Sheet Expansion
Source: Federal Reserve Economic Data.
By the second week of March 2020, as firms were sending employees home to work, financial markets were closed, with no true functionality until the Fed stepped in with not only Treasury and agency MBS purchases but with a commitment to purchase corporate debt for the first time in its history.
Summary
The past five years have presented some of the most challenging environments for fixed income investing that we have seen in our careers. Every area of the market has presented challenges in unique ways, from gyrations in the yield curve to the dueling impacts of the Fed reducing its balance sheet and then increasing it at a fevered pace to the influence of duration extension combined with spread compression.
Managing through this unprecedented five-year period has been challenging but our team was able to draw from its decades-long experience in managing fixed income portfolios to successfully navigate the twists and turns. The ever-changing environment has only reinforced our commitment to bottom-up, security selection and transparent and consistent communication with our clients. We look forward to continue delivering successful investment outcomes for our clients over the next five years and can only hope they are somewhat less eventful.
The Bloomberg Barclays U.S. Corporate Bond Index is an unmanaged index representing the investment grade fixed rate taxable corporate bond market including USD-denominated securities publicly issued by U.S. and non-U.S. industrial, utility, and financial issuers. The Bloomberg Barclays Treasury Bond Index measures U.S. dollar-denominated, fixed-rate, nominal debt issued by the U.S. Treasury. Index data source: Bloomberg Index Services Limited. See diamond-hill.com/disclosures for a full copy of the disclaimer.
The views expressed are those of the author as of August 2021, are subject to change, and may differ from the views of research analysts, portfolio managers or the firm as a whole. These opinions are not intended to be a forecast of future events, a guarantee of future results, or investment advice. Investing involves risk, including the possible loss of principal.